The Derivatives Magazine #17

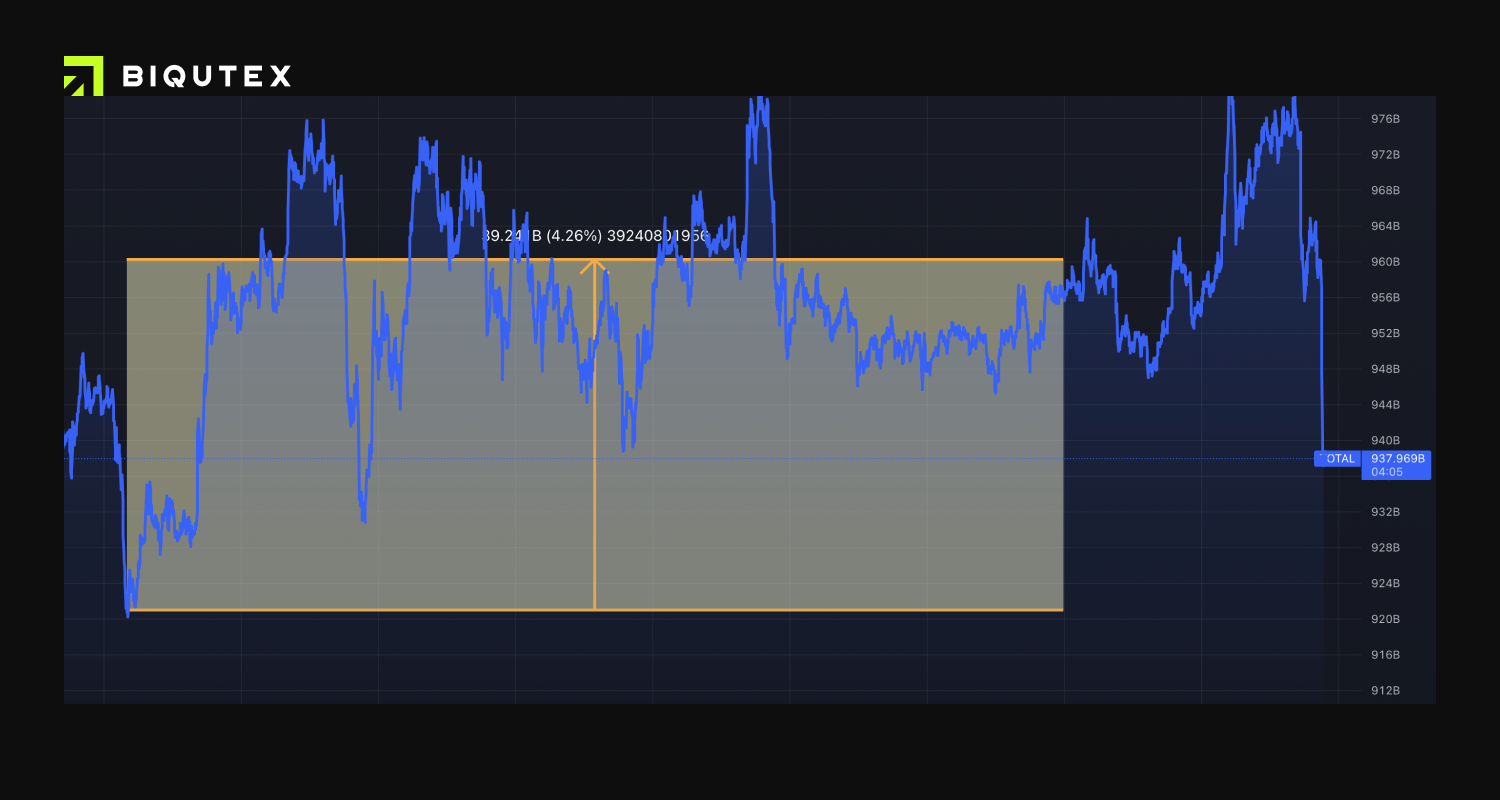
Crypto market capitalisation movements last week remained in a fairly narrow range. The lack of negative macro news allowed total capitalisation to hold steady at around $960 billion.
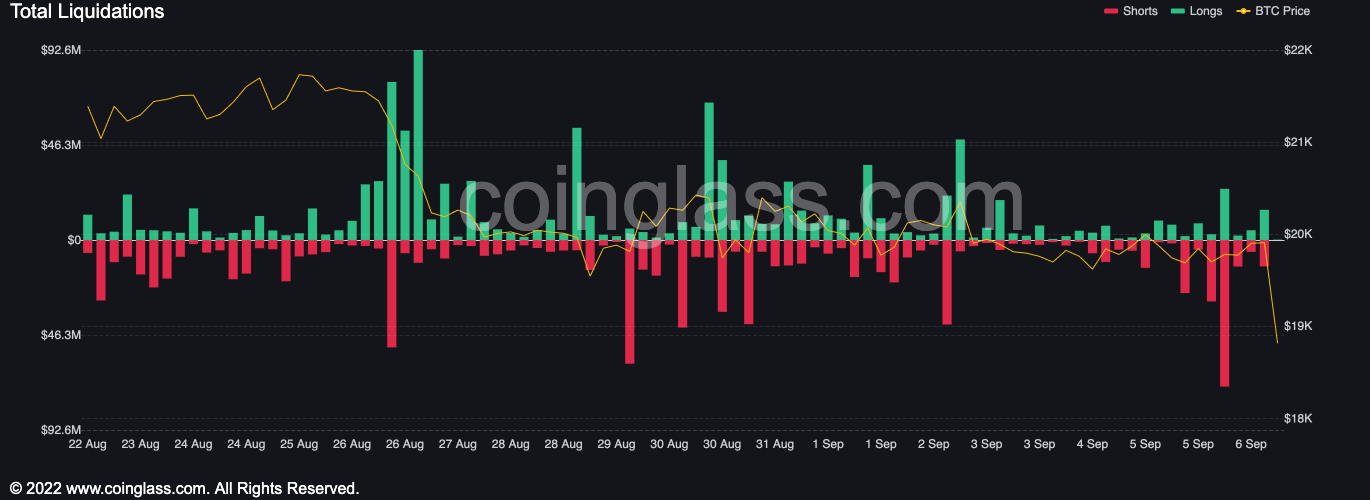
The relative tranquillity in the market during the working week was replaced by high volatility without solid news and further declines. Certainly, the lack of the liquidity that characterised past year's growth phase leads to increased price volatility even on a small trading volume. After a generally quiet week, the start of the current trading week session has been much more volatile, with a drop in the value of major crypto assets, primarily bitcoin, resulting in significant liquidations. BTC and ETH saw the bulk of the volume, totaling more than $400 million across all assets.

Last week's main trend remains in place, with all eyes focused on the "merge" process within the Ethereum network. The sharp drop in quotations on Monday led to an even greater demand for hedging short-term positions. The situation will probably change only after the whole process is successfully completed. The impressive difference between the current average funding rate of -16% for ETH and around 0% for BTC clearly indicates an interest concentration area for traders and investors.
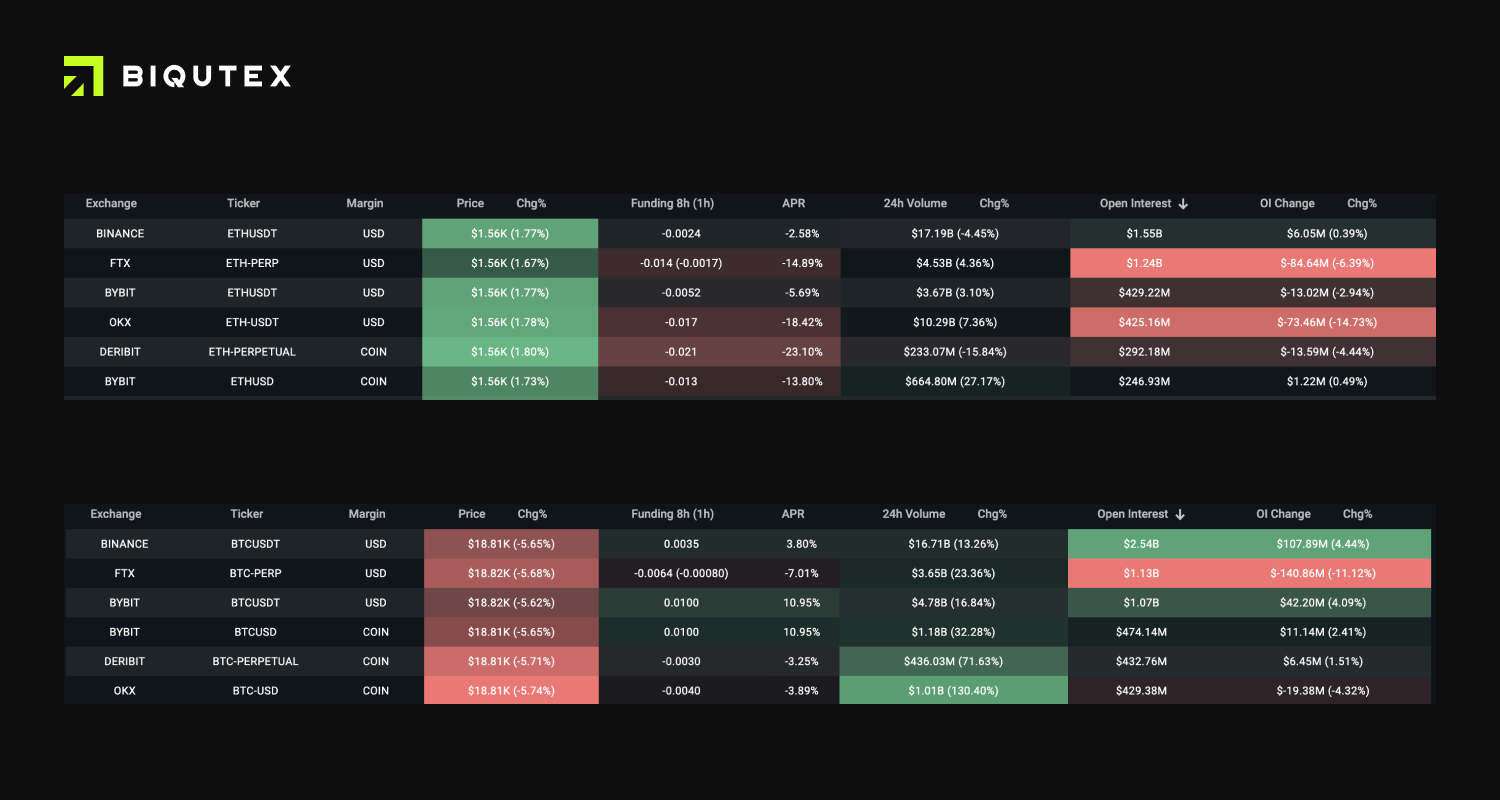
In the perpetual futures market, the situation is conceptually no different. The only difference is that the drop in the spot price below the psychological mark of $19 000 for BTC has motivated traders to open long positions more actively with leverage, in some cases the funding rate has exceeded 10%.
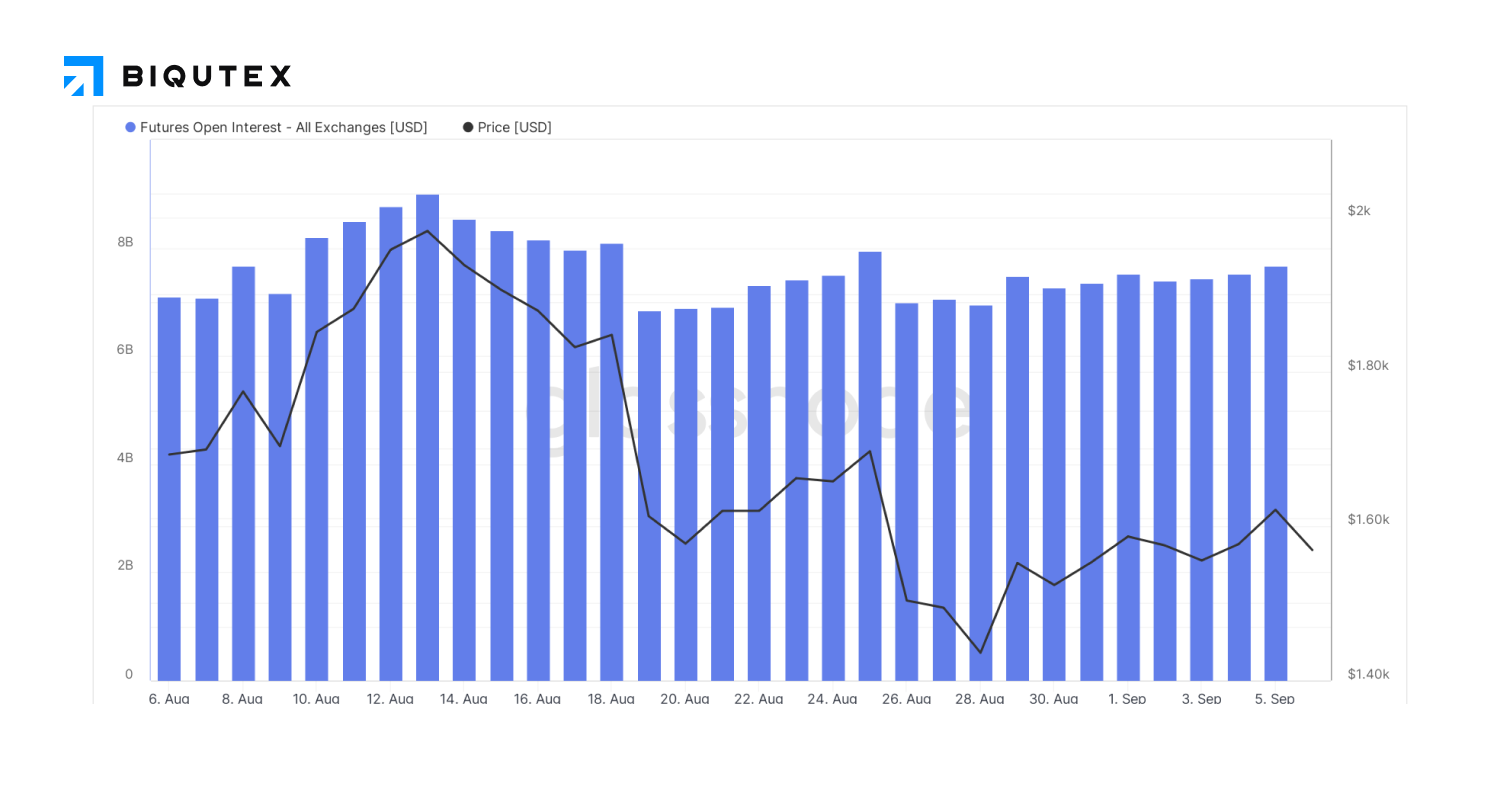
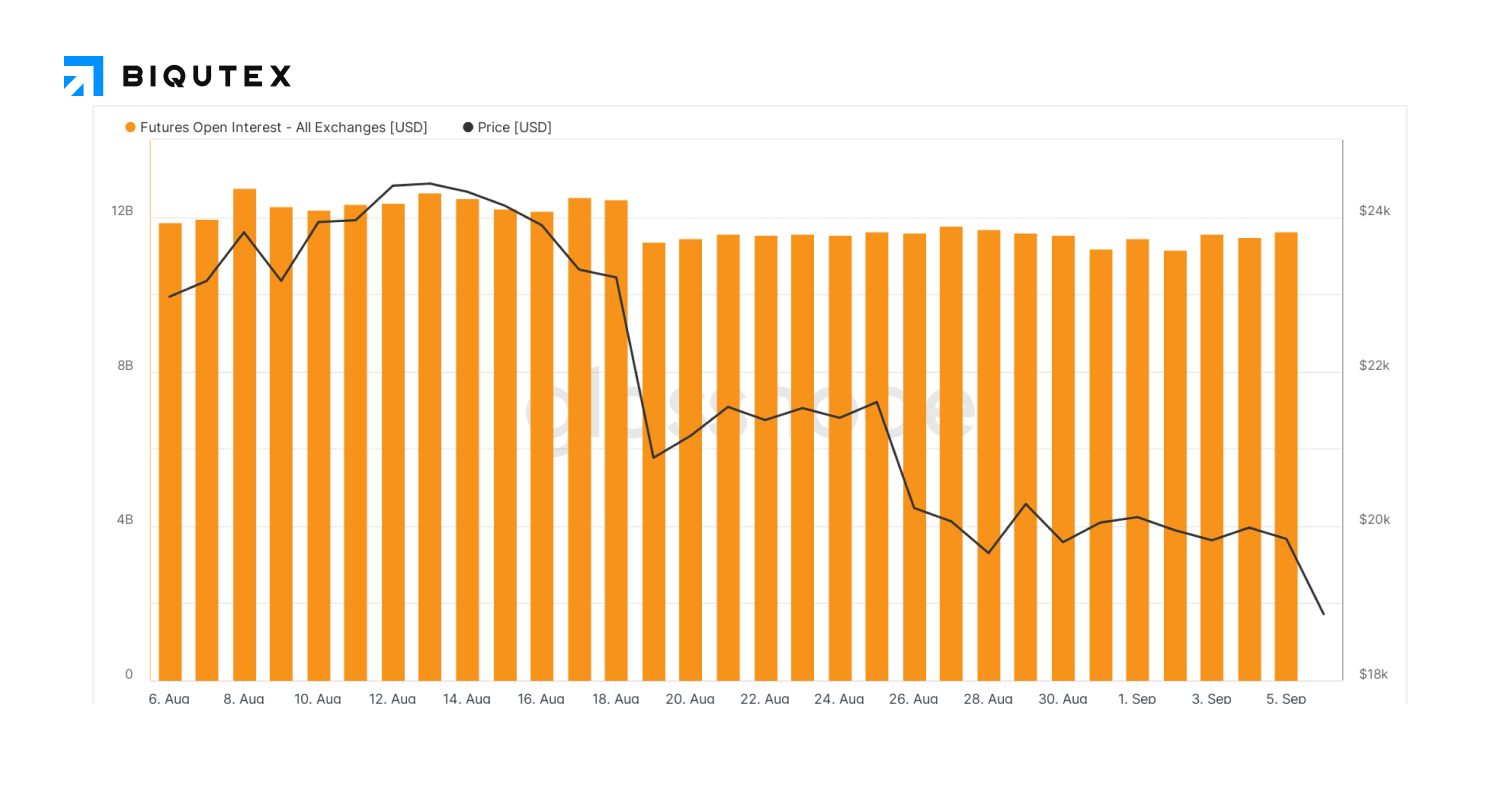
Trading volume in futures continues to be quite high. BTC's performance was just under 12 billion per day and remained stable, while trading volume in ETH derivatives increased slightly and came close to the 8 billion mark. Trading statistics also confirm the observation of prevailing interest in ETH, where, in the absence of its own growth drivers, BTC is directly dependent on the macroeconomic backdrop.
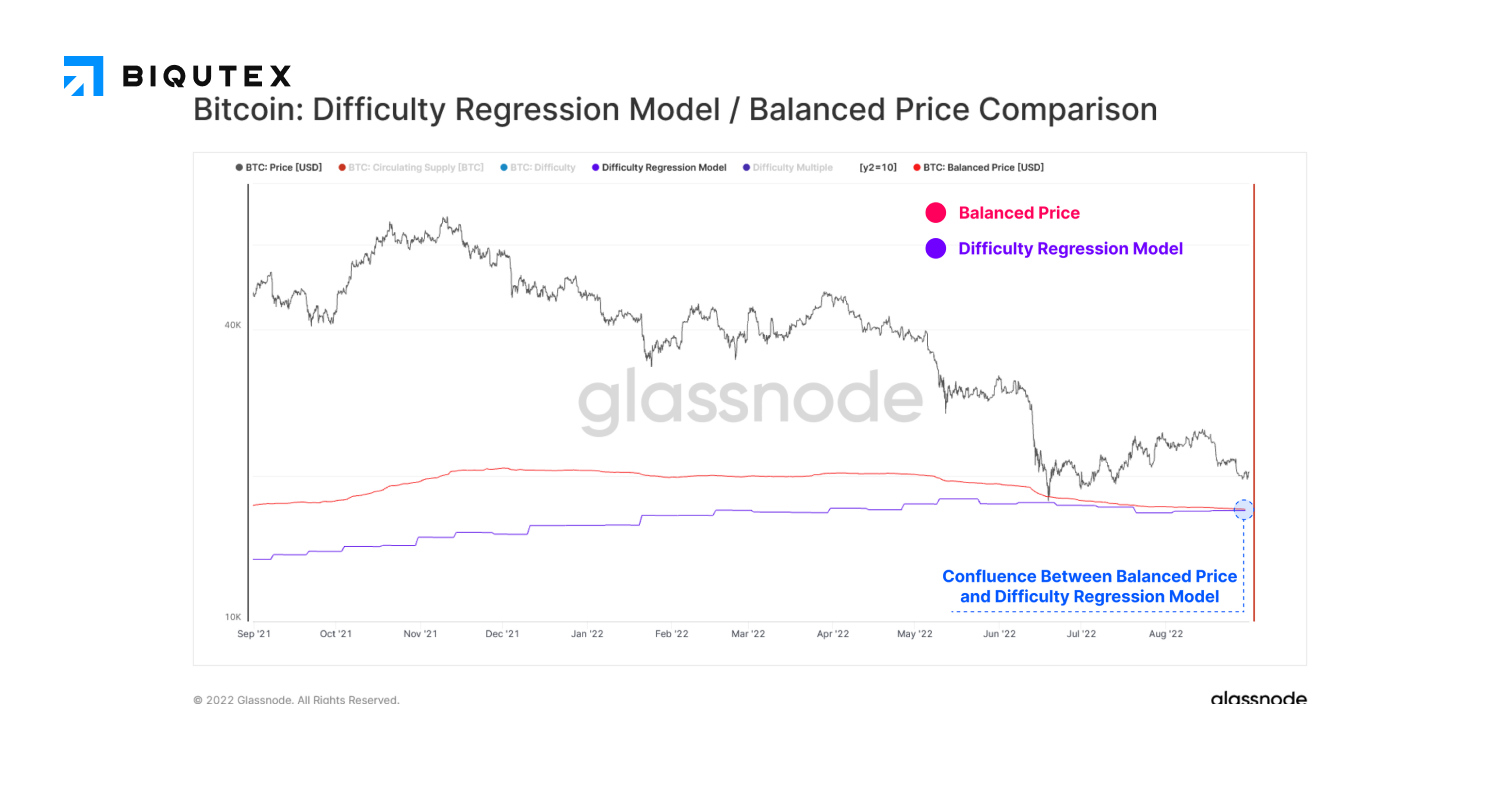
On-chain analysis of BTC prices continues to be one of the most accessible ways to determine macro price levels. On the chart above, the two models for determining the average Buy price (the difference between the Buy price and the Move price) and the Balance price based on a regression of complexity and capitalisation form a common local support zone at 17 000. While the focus of the industry has now shifted to Ethereum, BTC continues to be the most capitalised currency, being the alpha indicator of the entire crypto market, so determining local levels is still useful for traders in the medium term.
This overview was prepared by the analytics department of the Biqutex crypto derivatives exchange