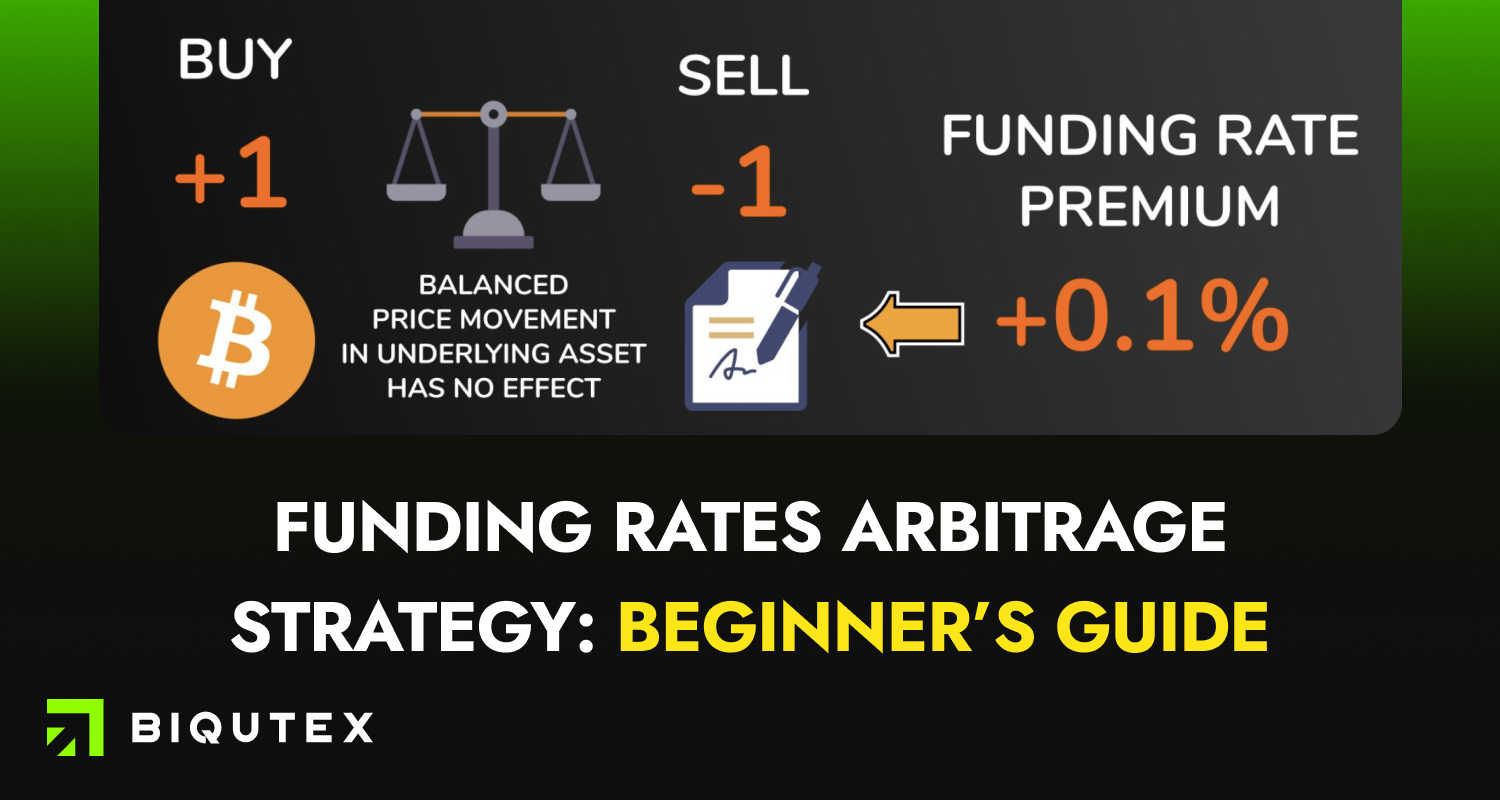
Spot-Perpetual Funding Rates Arbitrage Strategy: Beginner's guide
Introduction
Today we will analyze a market-neutral strategy that allows to make profit without taking significant risks inherent to conventional cryptocurrency trading. The trader earns on the difference between the price of the underlying asset on the spot market and the perpetual futures for the same asset.
Traditional futures contracts, such as the S&P 500 Futures, have a fixed expiration date. Most often once a month or a quarter. At the time of expiration of the contract, its price is equal to the spot price. The settlements are performed on all positions of the expiring futures, and they are closed.
In addition to futures with a fixed expiration date, cryptocurrency exchanges offer perpetual futures contracts. Also called perpetual swaps. These contracts have no expiration date. This allows investors and traders to hold open positions for as long as possible. There is no need to close positions in the expiring contract and switch to a new one.
This makes trading perpetual swaps similar to trading spot cryptocurrency pairs. What are the differences? First of all, the commissions, which are lower in perpetual swaps. Also, the large amount of leverage that a trader receives on swaps when opening both long and short positions.
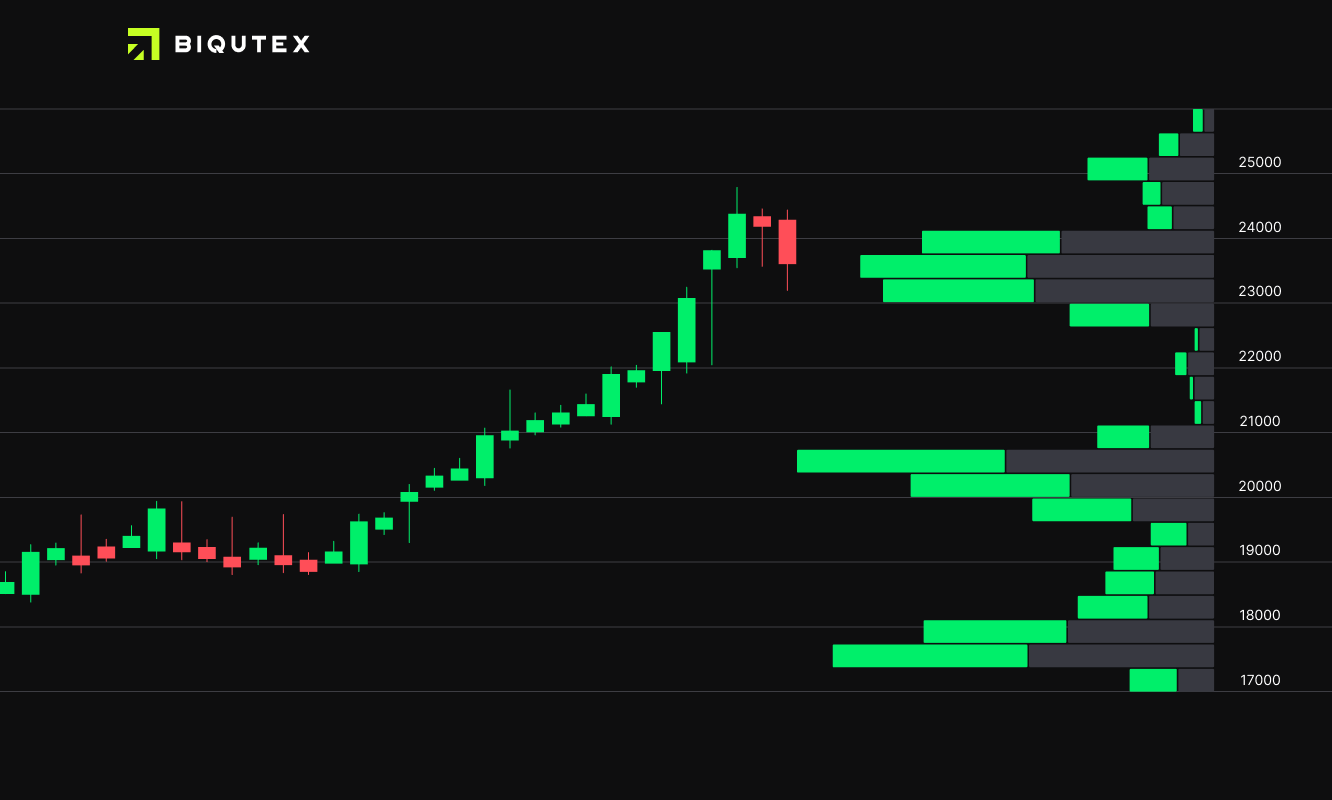
Since a perpetual contract never expires, its price can be very different from the spot market index price. For example, if most traders expect the price of the underlying asset to rise, they can open positions with more leverage on the perpetual swap. And the more such positions are opened, the wider the spread between the price of the underlying asset and the futures price widens.
To prevent this from happening, cryptocurrency exchanges have invented a mechanism called Funding Rate. It's an interest rate whose job is to peg the price of the underlying asset to the price of the perpetual futures.
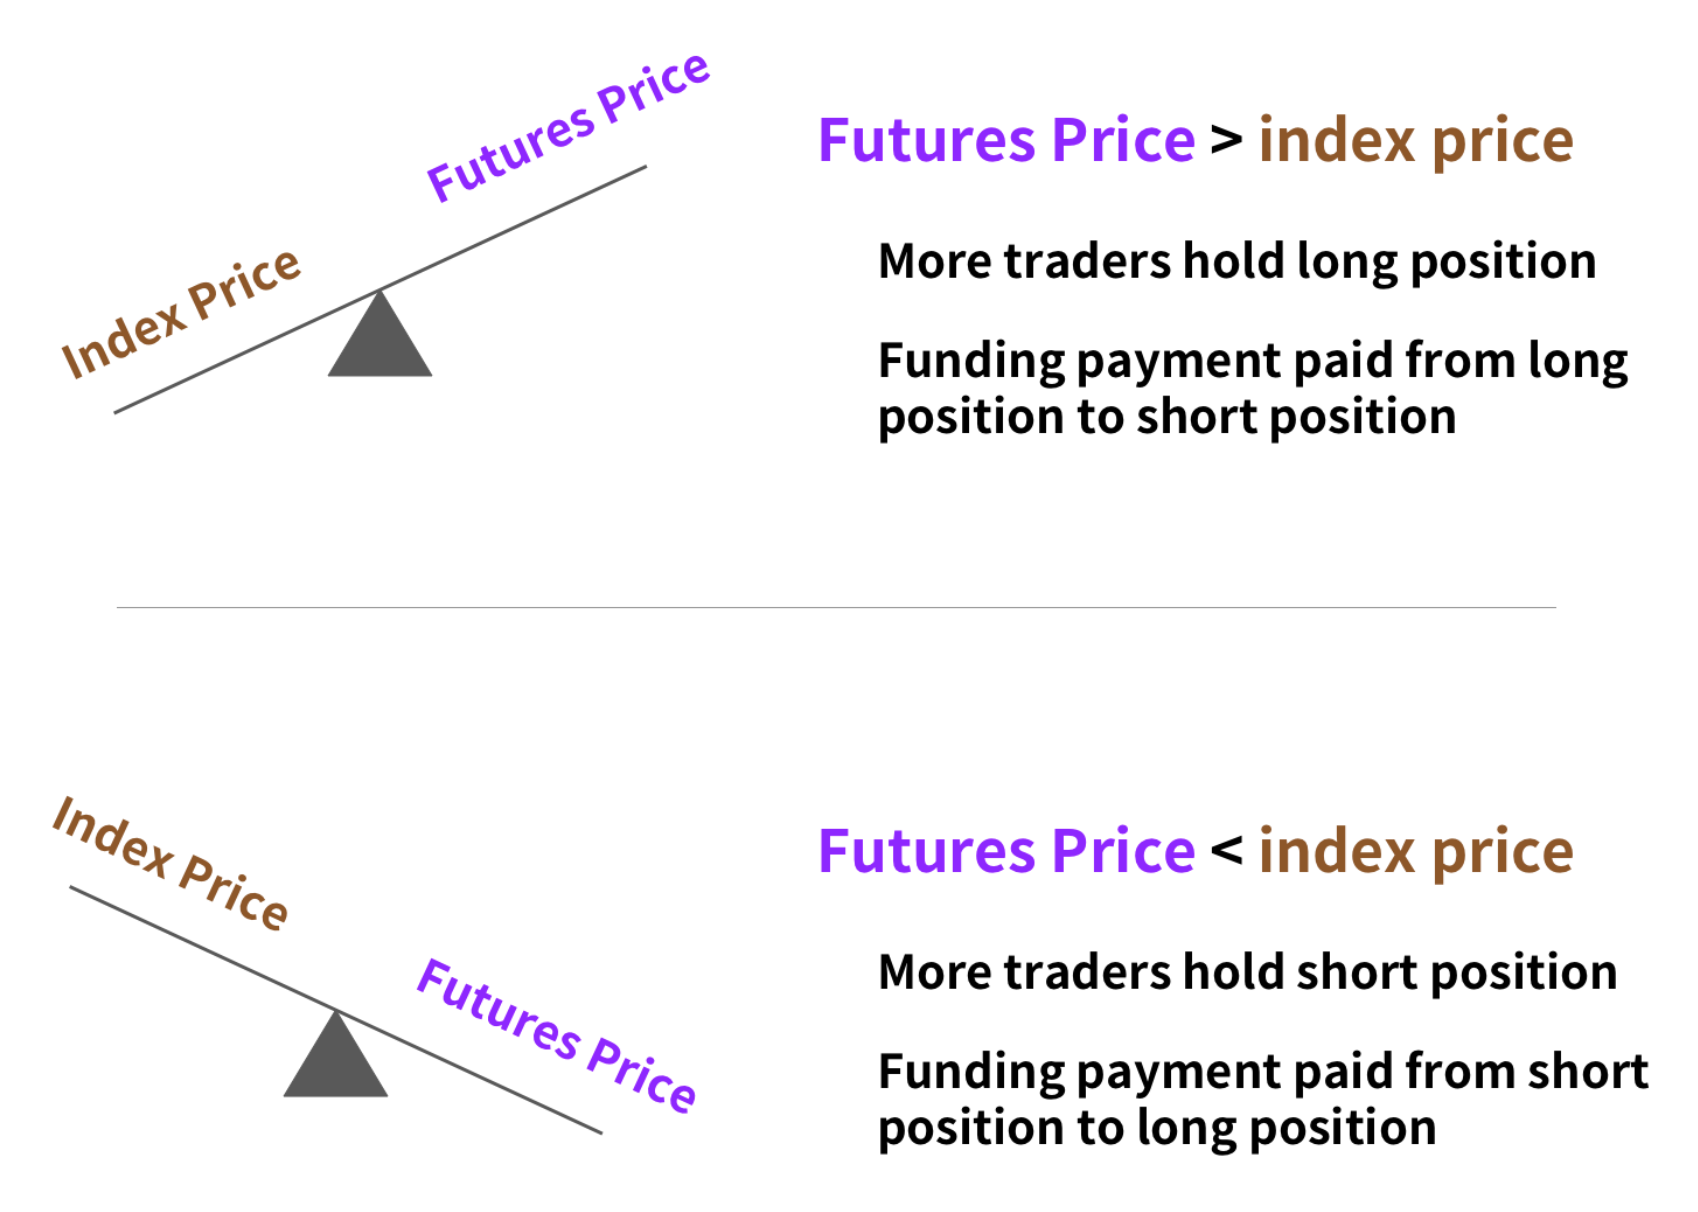
If the perpetual swap price is higher than the spot market index price, the interest rate is positive. If the perpetual swap price is lower than the index price, the interest rate is negative.
When the interest rate is positive, long position holders pay interest to short position holders. And vice versa. Calculations are made automatically between traders. The exchanges do not receive any profit or commissions from the Funding payments.
Funding Profit Calculation Example
If Funding Rate = 0.01% and there is a position opened without leverage of $10,000, the Funding Rate will be $10,000 * 0.01% = $1 ($3 profit of the strategy per 24 hours)
If Funding Rate = 0.01% and there is a position c leverage 10x of $10,000, the funding will be $100,000 * 0.01% = $10 (about $30 profit per 24 hours)
Cryptocurrency exchanges have different accrual intervals for Funding Rate. For example, on exchanges BitMEX, Binance, Bybit, OKX, Kucoin funding rate is charged every 8 hours, which is 3 times a day. On FTX every hour or 24 times a day. On Biqutex, it is calculated every minute.

Biqutex Exchange
Biqutex is an innovative crypto derivatives exchange. Trade an extended list of instruments (Perpetuals Swaps, Futures, Options, Calendar Spreads etc.) with up to 125x leverage and deep liquidity!
How is the Funding Rate calculated?
Different exchanges use different methods of calculation. In most cases, Funding Rate is determined by two components: Interest rate and Premium (Discount).
At the time of writing, most exchanges use a fixed base interest rate of 0.03% per day. Or 0.01% at a funding interval of once every 8 hours.
Why is the basis interest rate not equal to zero? The cryptocurrency market is supposed to grow. And it really is, if we look at its history. So, if we hold a long position through a perpetual swap, we have to pay the counterparty that provides the cash equivalent. The basis interest rate is directly related to the funding rates of the world's money markets. For years, the interest rate on short-term U.S. Treasuries has been around 0.0-0.5%, and on 10-year bonds around 2%. It is fair to say that the beginning of the rise in dollar rates could lead to an increase in the basis interest rate used to calculate the Funding Rate.
To calculate the premium (discount), we use a complicated formula, which we will not go into now. Here's what you need to understand in this case: the more buyers of Perpetual swaps (as compared to sellers) in the market, the higher the premium. And vice versa. The more sellers there are in the market (compared to buyers), the higher the discount. It means that Funding Rate is close to 0 or goes to negative values.
Where to look Funding Rate for a certain instrument?
- Most exchanges show the current and predicted Funding Rate right in the trading terminal. In the same tab, we also see the remaining time until the next accrual of funding. In the screenshot below is the terminal of Biqutex exchange:
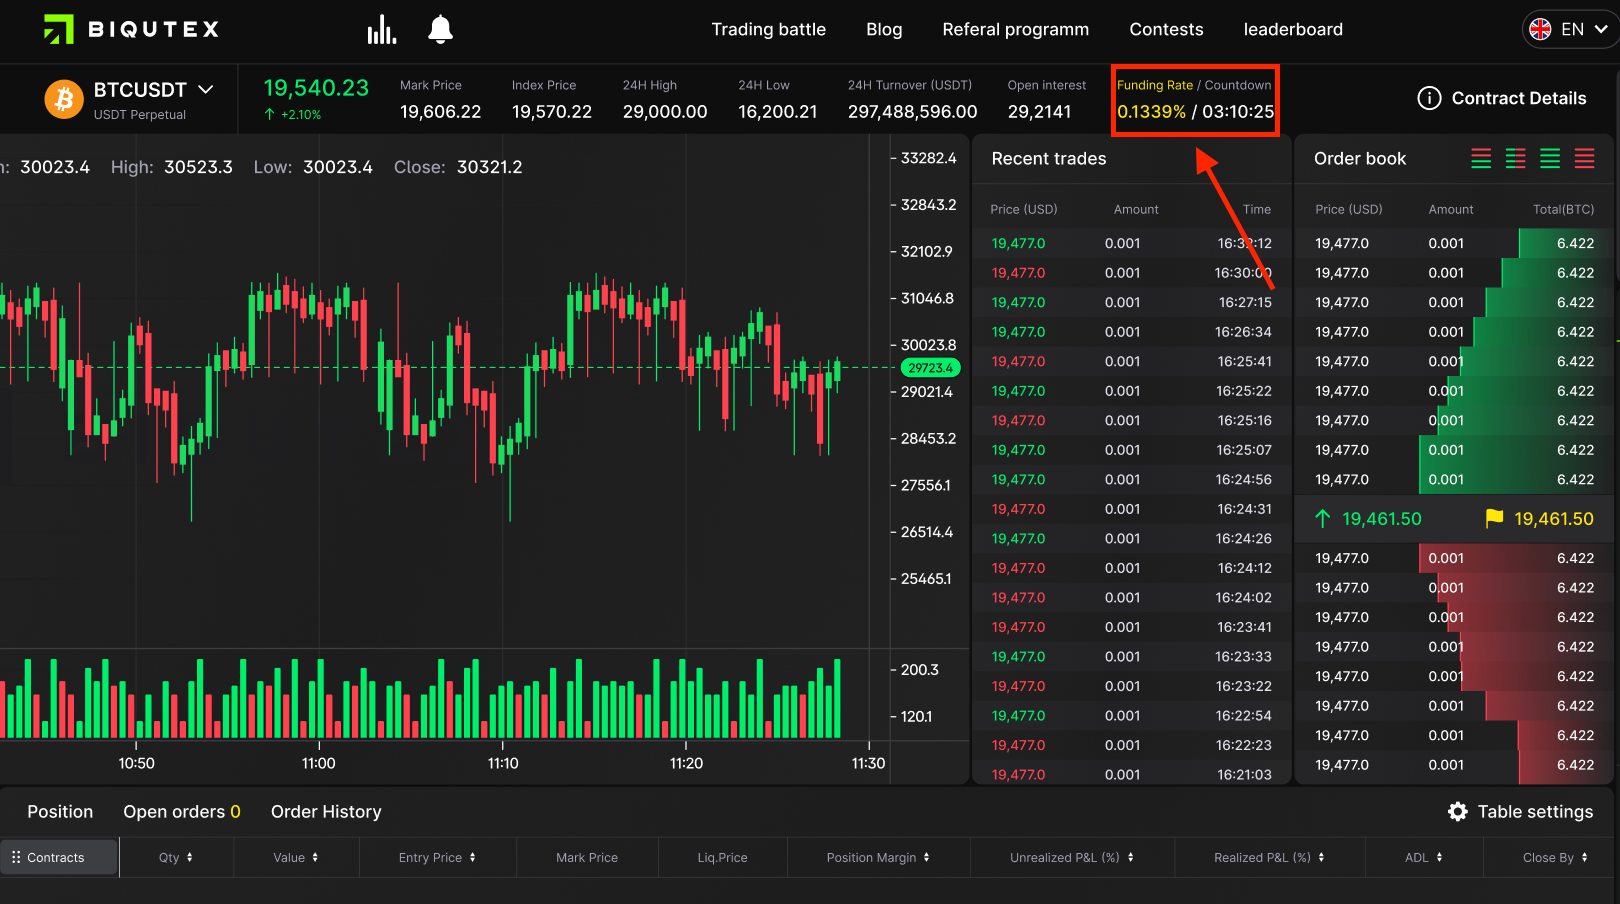
2. You can also check the interest rate set for the current and next funding time for each perpetual swap in the "Contract Details" section.
Important! The current and estimated Funding Rate are not fixed. They are constantly updated according to the interest rate and premium (discount).
For example, a positive Funding Rate can quickly turn negative when the value of a perpetual swap falls dramatically. In this case, some of the long positions may be liquidated. Conversely, the bears will increase the number of short positions.
Why is the Funding Rate higher on some exchanges and lower on others?
Exchanges are interested in lower Funding Rate. Because they are competing for traders who prefer lower Funding Rates. Why? The lower the Funding Rate, the less it affects the profit/loss on executed trades. This is especially true for algorithmic trading.
A lower Funding Rate implies great liquidity and very simple arbitrage. The latter implies an instant transfer of money between the spot and futures markets. It is the desire of traders to earn on arbitrage that allows the Funding Rate to return to its average values after some time.
How to make profit on Funding Rate arbitrage?
Let's take a look at the most common risk-free market-neutral strategy for making profits on gathering Funding rates.
We buy (open a long position) BTC on the spot market. And we sell (open a short position) a BTC-PERP perpetual futures contact for the same amount. The resulting position is fully hedged, and you don't lose when BTC price changes, because losses from falling prices will be compensated by the opposite short position on the futures contract, and vice versa. But the difference is that every funding period (from 1 minute to 8 hours depending on exchange) on our position on perpetual futures is charged with ~0.01% daily.
Is this a much or not? 0.01% * 365 = 9.5% APY. But since we additionally purchased an underlying asset, the real return on the capital invested in the strategy is divided by two. And it is about 5% APY. Of course, it is of little interest to traders.
However! At the moments when the market starts a rising trend, there are more and more traders willing to enter into a long position with a leverage, through the purchase of a perpetual swap. This means that the spread between the underlying asset and swap starts to widen. In this case, the Funding Rate starts rising rapidly. It may amount to ~0.1%-0.3%, or even 1% for some coins for every 8 hours of funding.
At average Funding Rate of 0.05%, profitability of this strategy (buy spot, sell perpetual swap) is ~20-25% APY. The risks are minimal.
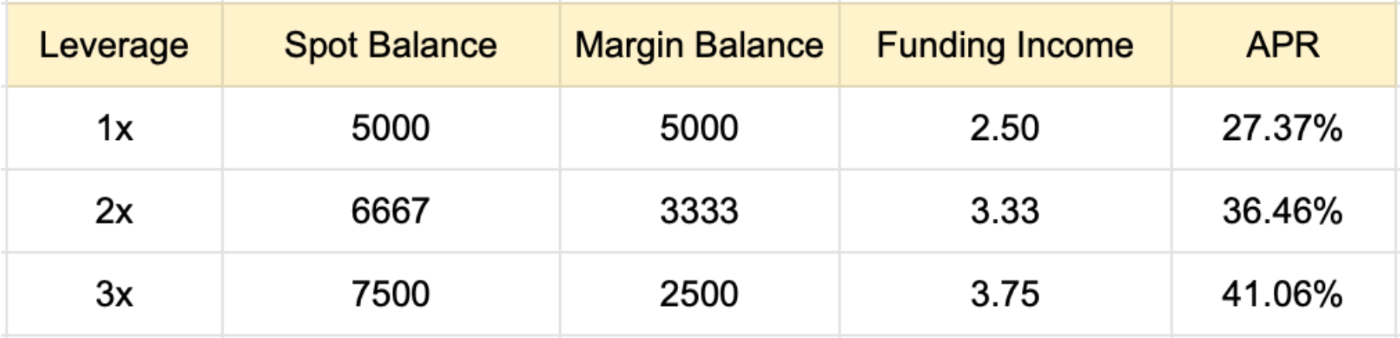
Is it possible to improve the strategy and increase the profit? Yes, we can. We know that profitability growth = risk growth. In this case we can use a 3x leverage on a perpetual swap. That is, sell a $1,000 futures, provide only about $330 of margin.
This gives an opportunity to raise the strategy's profit up to almost 50% APY on invested capital!
Where to look up funding rates for different exchanges?
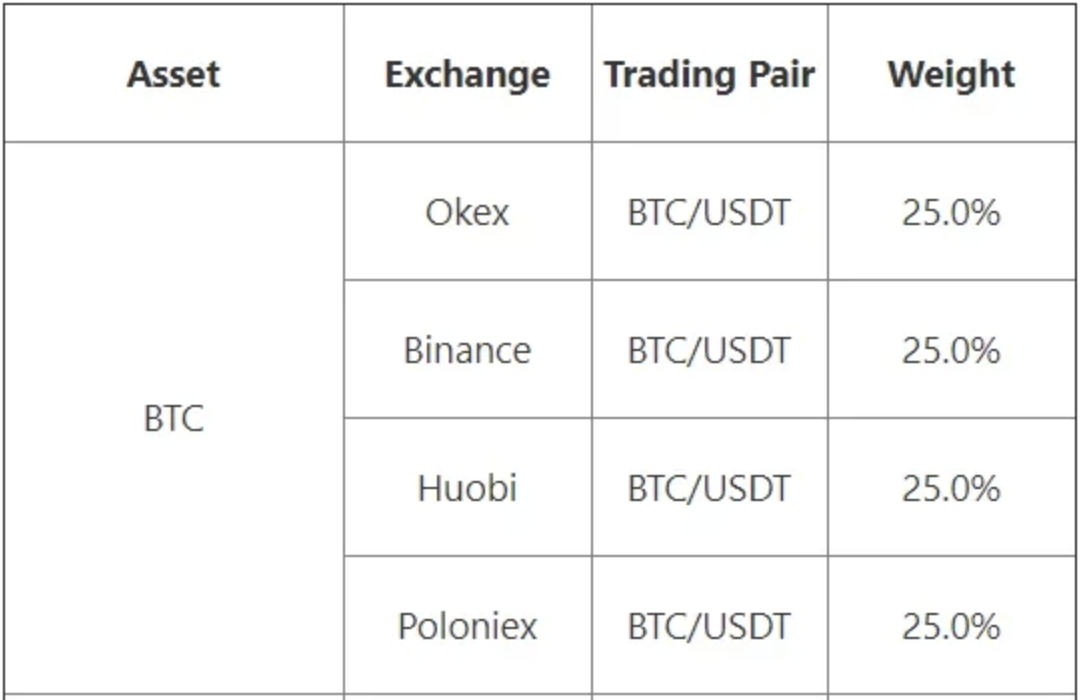
One handy resource is Coinglass: https://www.coinglass.com/FundingRate
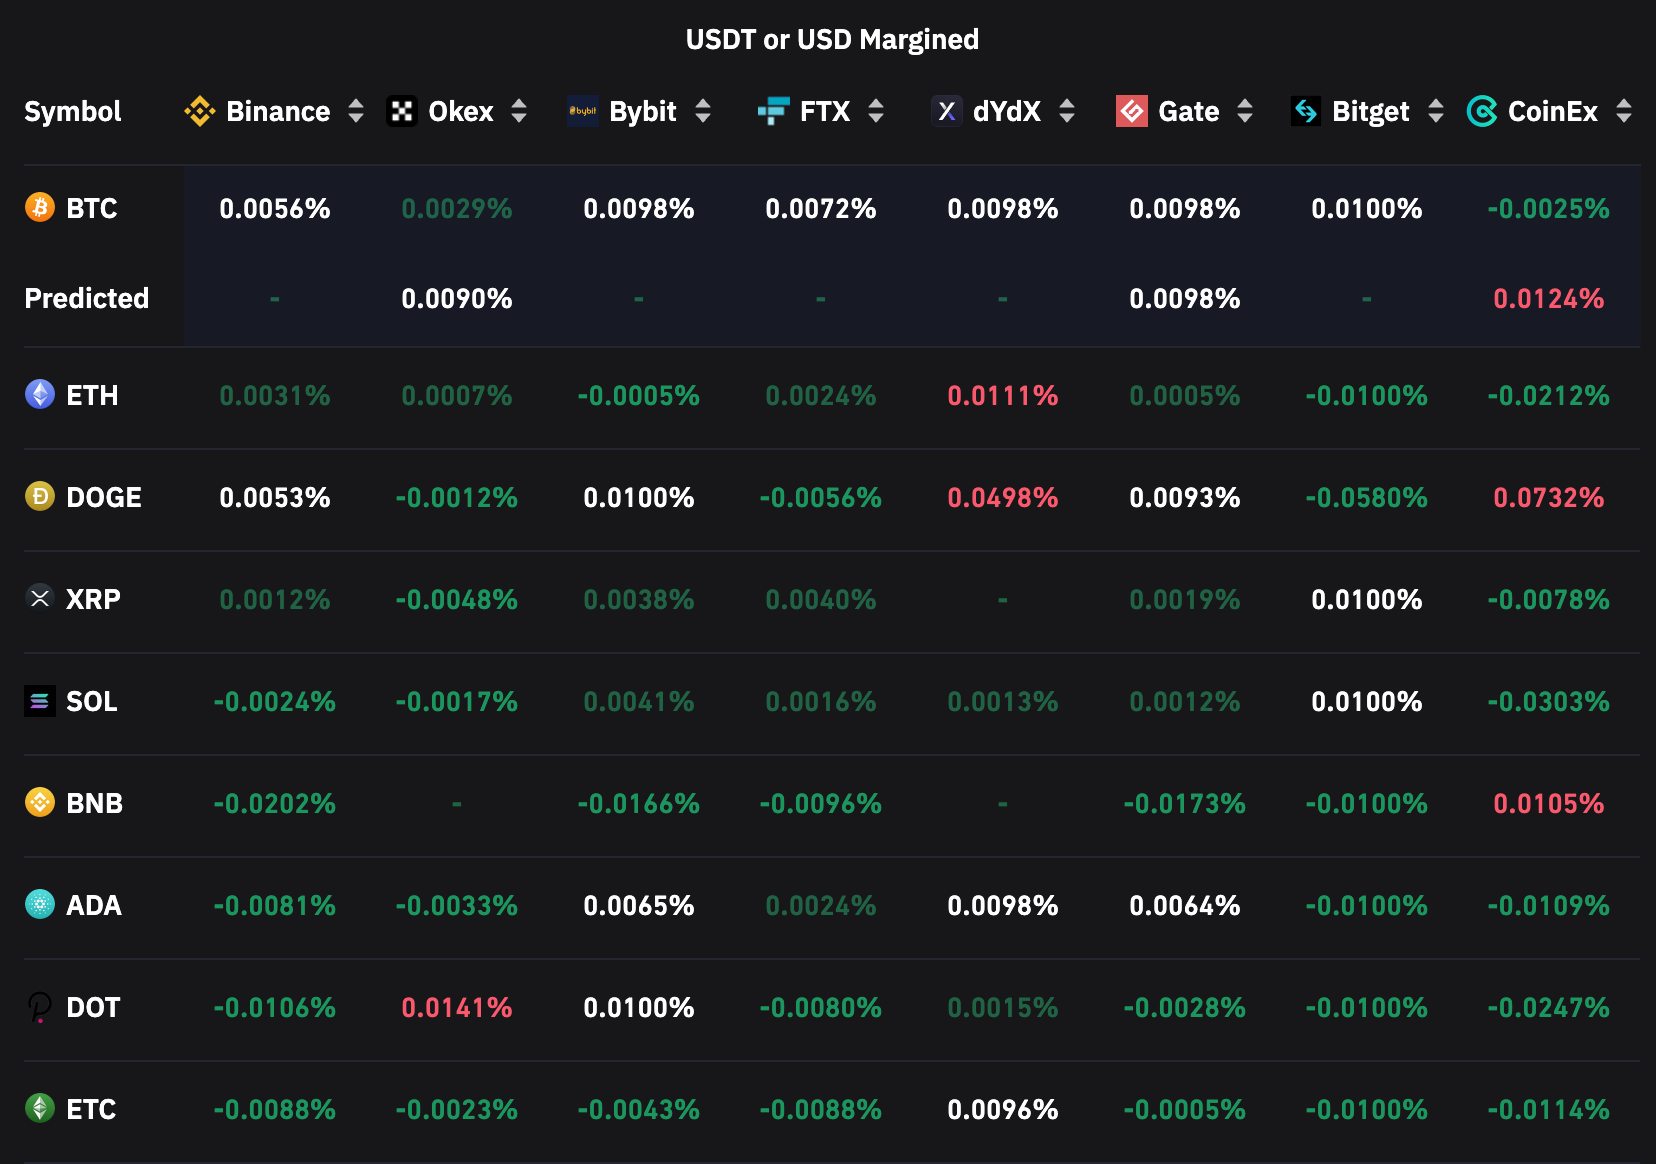
We see the amount of the nearest funding rate for 8 cryptocurrency exchanges. And if we put a tick in the "Show Predicted" field, we also see the amount of the next expected funding rate.
This strategy works great when the cryptocurrency market is growing. And the stronger the trend, the more the strategy earns, as Funding Rate becomes abnormally high.
Examples of extremely high rates from history
For example, September 2021, Kucoin exchange. ETH/USDT pair. Accrued Funding Rate (screenshot below) was 2.2% for 4 days. Which even without compound interest is over ~200% APY.
However such mastodons by capitalization as BTC and ETH are not indicative. Coins from the top 10 in terms of capitalization, such as ADA, show even stronger anomalies. That said, they are "big" enough not to allow themselves to be heavily manipulated. We will talk more about the risks of these manipulations below.
Kucoin exchange, August 2021. ADA/USDT pair. The accrued Funding Rate (screenshot below) was 3.8% over 4 days. That even without compound interest is about 350% APY.
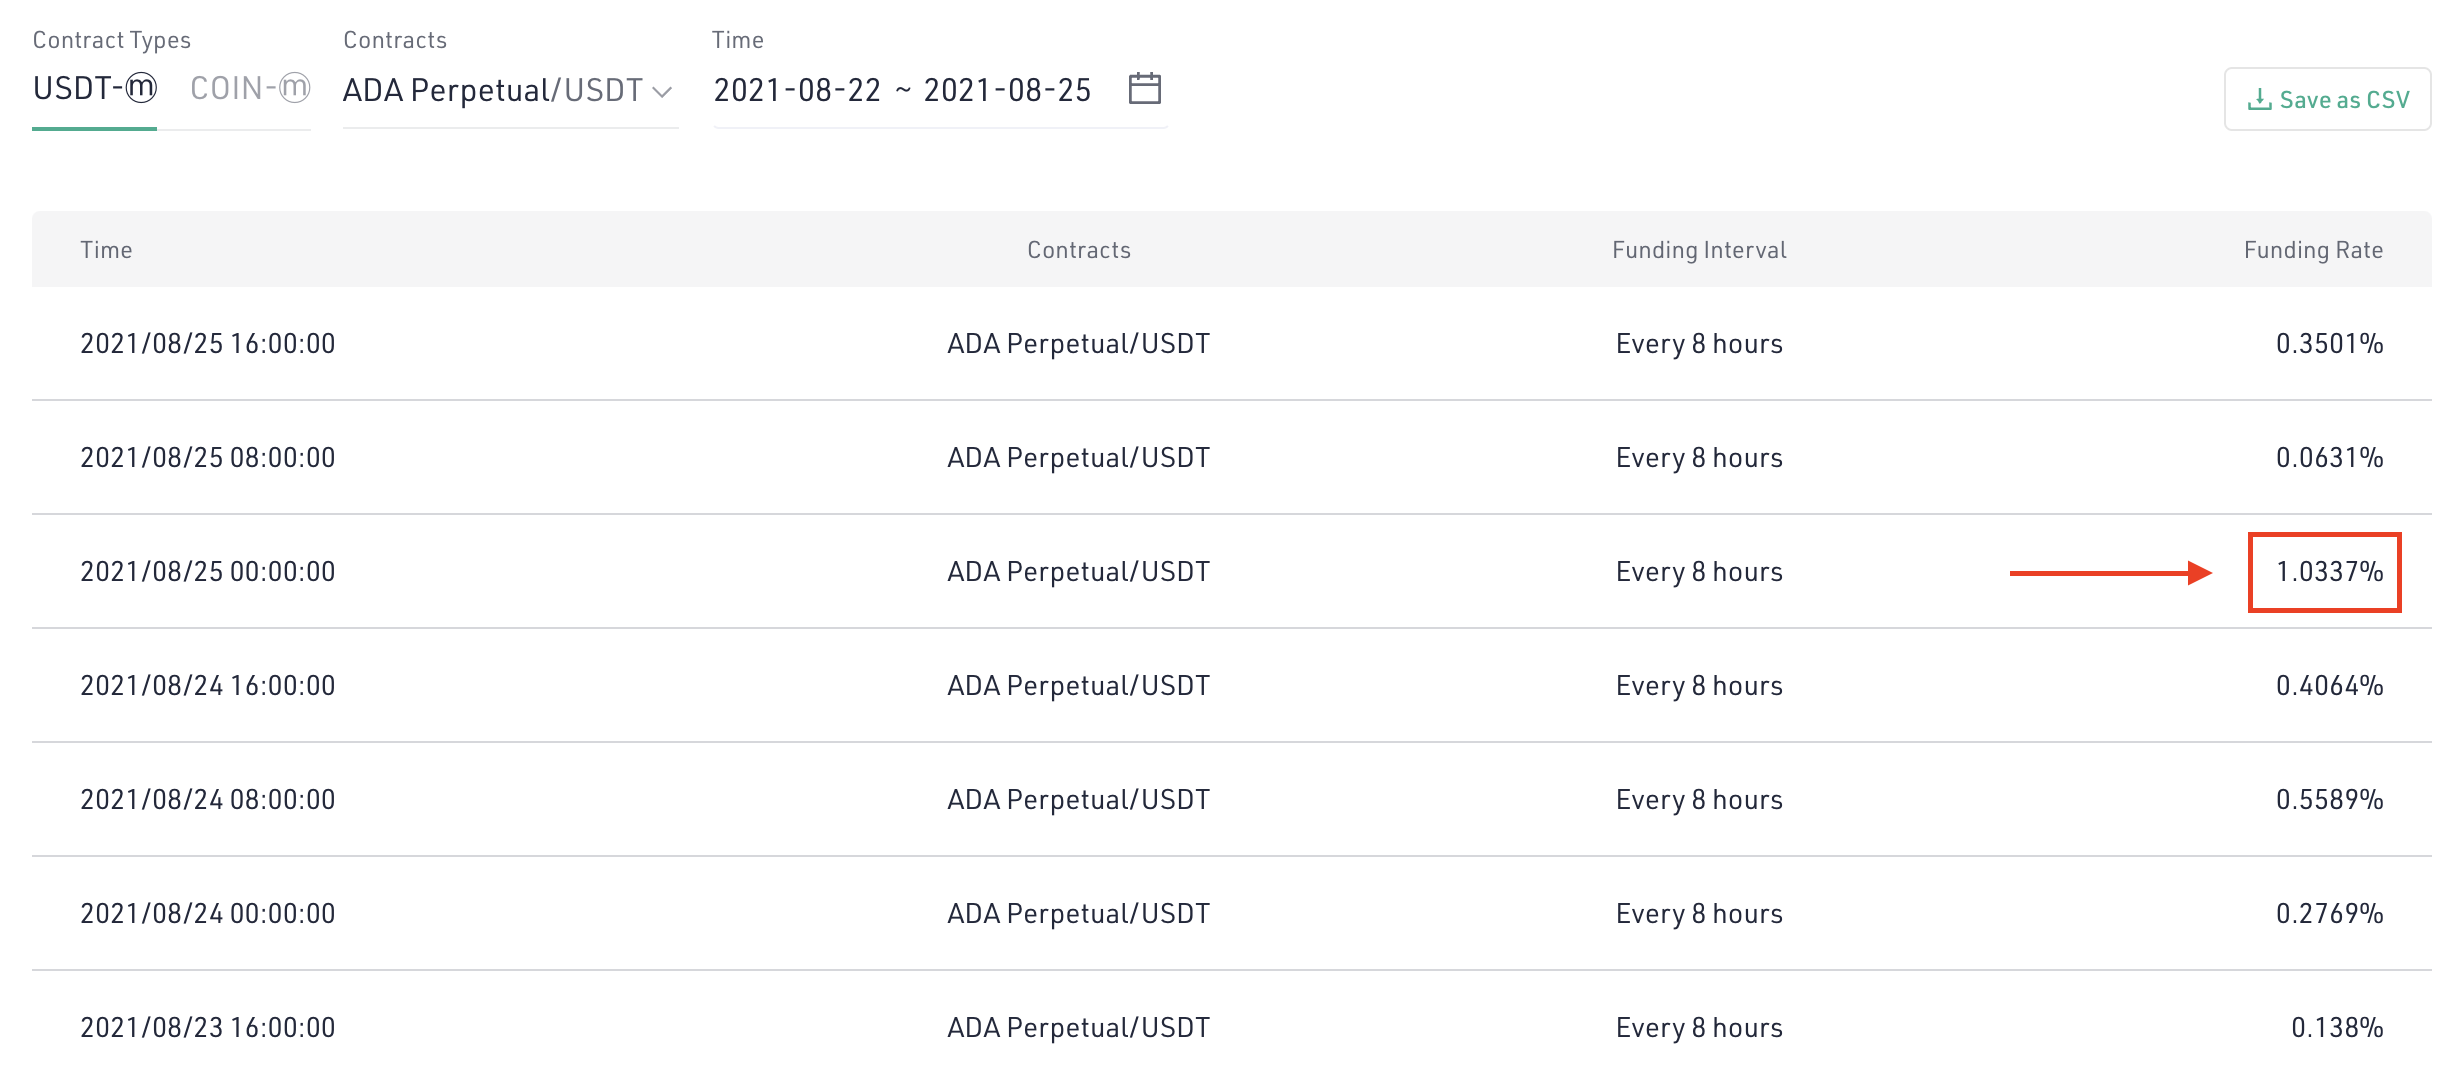
Observe the date 2021/08/24 23:00:00. No! You are not mistaken. Indeed, there was an accrual of 1.03% just for 8 hours!
You can yourself look at historical data on Funding Rate on each of the exchanges.
Question from an attentive trader
It is all good, but on the history we always see where the trend and the flat were. But no one can predict in advance the beginning and the end of a trend. Consequently, what is the point of this strategy?
Excellent question! But the devil is in the details. Let's look into it.
Why is it so hard to trade a trend manually? Because we never know when the trend will break. If we use short stops, they will always break. If long stops are placed, or no stops are placed at all, a broken trend can result in huge losses. The problem is that when the trend becomes obvious to all traders and everyone enters it, this moment is often the culmination. Many traders have not yet earned anything on it and immediately take losses.
The strategy of earning on arbitrage with fundings is different. We enter a position (by buying spot and selling a perpetual swap) when the Average Funding Rate starts to rise. For someone it will be 0.15% in 24 hours, and for someone it will be 0.3%. We do not even need to look at the chart. And think about when the trend is over.
- If the trend continues, then we get a guaranteed income several times a day (the financing rate is charged).
- If the trend starts to slacken or there is a reversal, the Funding Rate often does not decrease. It may even increase. On a rollback, many traders, who have not yet entered the trend, go long.
- If the trend finally breaks, we do not lose anything, unlike traders who trade with the trend. The Funding Rate goes down. We are not interested in staying in a position. We close both spot and swap positions and go into the money, with a profit locked in at Funding Rate.
Risks of the strategy
The main risk is that the price will rise sharply and the short on the perpetual swap will be liquidated. Then the following situations are possible:
- Price continues to move sharply upwards. In this case we make a big profit. Since our underlying has increased in value more than we lost on the perpetual futures position which was liquidated.
- The price of the underlying asset is at the same level as the perpetual futures liquidation. In this case, we close the spot position and keep our money.
- The price has fallen dramatically. We incurred a loss on the perpetual futures which were liquidated. We did not have enough time to close the spot position. In this case, we are guaranteed a loss equal to the size of the drop in price.
Another more rare risk is when the price of the perpetual futures rises sharply, for example by 50%, leading to the liquidation of the short position. And the underlying asset rises only by a value of 2-3 times less, and then begins to fall. That is, we are guaranteed to get a loss.
Such situations are very rare and occur only in low-liquid assets. Especially if the spot market for a given coin is available on several exchanges, and a perpetual swap is available only on one of them. If you see a high Funding Rate on such a coin, you should stay away from it. Or at least observe money management, without investing a lot of money in this arbitrage.
Additional questions about earning on Funding
- Can I make money from a reverse strategy? By selling a spot pair and buying a perpetual swap when the Funding Rate takes a negative value?
Theoretically, you can earn. At the least you need to have this pair on the spot or borrow it. In practice it is very difficult. A negative Funding Rate for a week or month is very rare. In addition, it almost never takes abnormal values, as in the above examples with an abnormal positive Funding Rate. That is, in many cases, the profit will be equal to the commissions on both deals.
But with this strategy there is another, little-noticed, but very serious risk. When we sell a perpetual swap on a coin from the top 10 by capitalization, the chance of a sharp drop in the asset by 30%-50%-100% is extremely small. But the odds of seeing a 30%-50%-100% drop, which would lead to an instant liquidation and then the price going back up, are at least an order of magnitude higher.
- Why use a strategy to make money on fundings during a strong trend? After all, you can simply follow the trend and earn much more?
We have already answered this question partially above. When there is a strong upside trend, traders get greedy. It seems to them that earning 5%-15% a month on fundings is not enough. Indeed, Bitcoin or Ether can go up 5%-15% even in 1 day.
The problem is that we never know if the trend will continue further. And if the trader did not guess the entry point, instead of profit, he can stay in the position, suffering large losses.
- We can see on Coinglass that on different exchanges the nearest Funding Rate can be very different. For example, on one exchange to be -0.05%, and on another 0.05%. Or at one exchange 0.03%, and another 0.12%. Is there an opportunity for arbitrage here?
It should be understood that this divergence is likely to be relevant only for the nearest Funding Rate. This means that it is critically important whether we will be able to recover the commission costs + slippage first on entering the position and then on closing the position. If the difference is less than 0.5%, then in most cases it makes no economic sense to do so.
Moreover! Abnormal differences in the Funding Rate on different exchanges for 1 coin may carry huge risks. Sometimes this gap may even be 2%-5% per day. If you do not understand why this happens, in any case, do not try to arbitrage.
The classic story in which a huge majority of arbitrageurs took big losses is OMG coin stacking for BOBA token airdrop. We will cover this story in detail in a separate article at some point.
✅ Answer the questions about this strategy and receive $3 Fee Bonus + 200 Points in the Learn and Earn program at Biqutex Exchange

This guide was prepared by the analytics department of the Biqutex, an innovative crypto derivatives exchange. Trade an extended list of instruments (Perpetuals Swaps, Futures, Options, Calendar Spreads etc.) with up to 125x leverage and deep liquidity!