Trend lines in technical analysis: step by step guide for trading
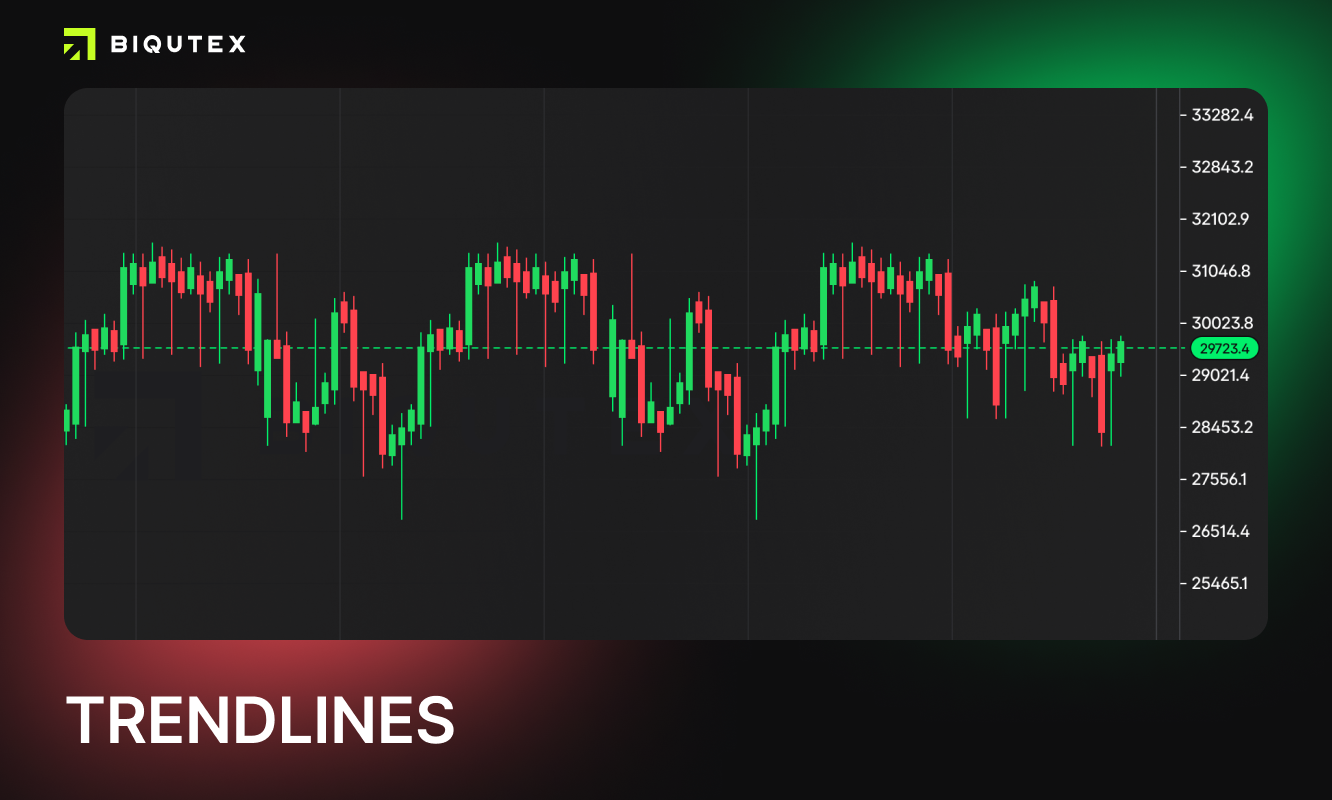
Trading trendline are a popular tool used by traders to identify trends and make predictions about the direction of the market. These lines are used to connect a series of price points on a chart, creating a visual representation of the direction of the trend. In this article, we will explore what trend lines are: uptrend line, downtrend line, sideways line, how they work, and the different types of trend lines available.
What are trend lines and how do they work?
A trend in trading refers to the direction that the market is moving in. This can be either upward, downward, or sideways. Trend lines are used to identify these trends and predict their future direction. Сrypto trend lines are no different from trendlines in stocks and work on the same principle.
Trendline crypto are a simple yet powerful tool that can help traders make informed decisions about when to buy or sell a particular asset.
Trend lines work by connecting a series of price points on a chart. These lines can be drawn in different ways, depending on the type of trend line being used. For example, a simple trend line is drawn by connecting two or more price points on a chart.
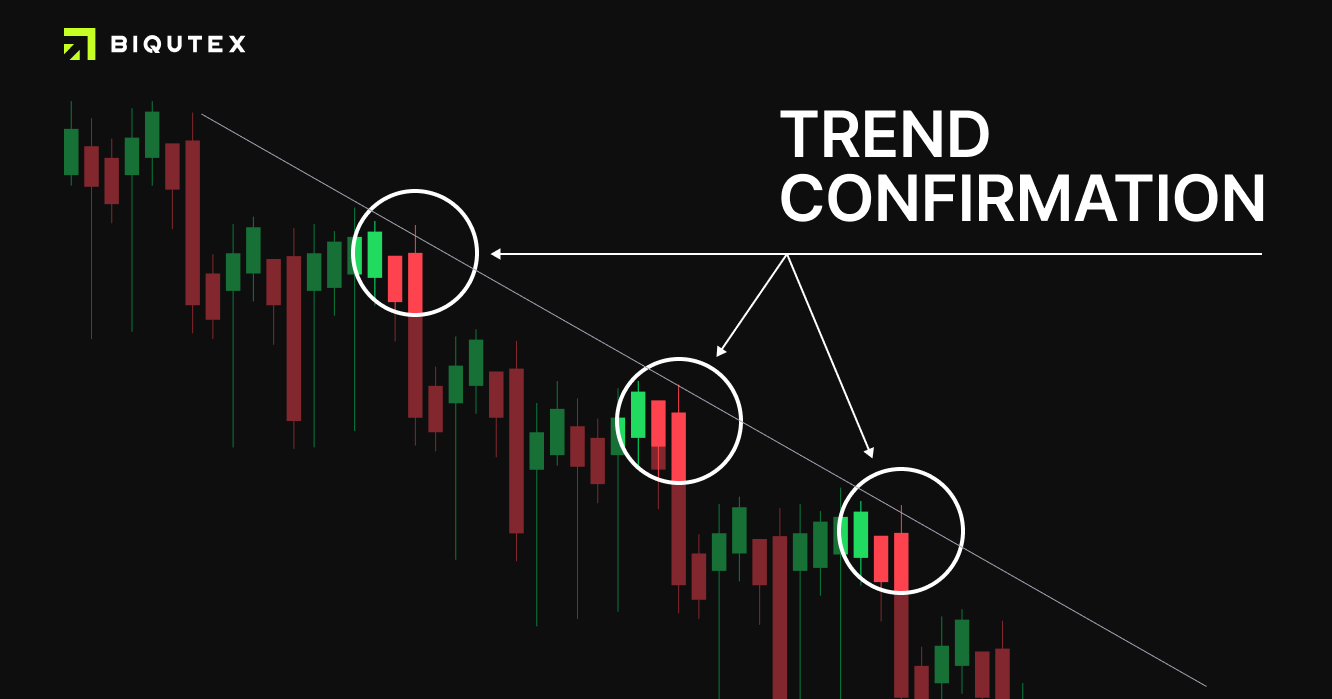
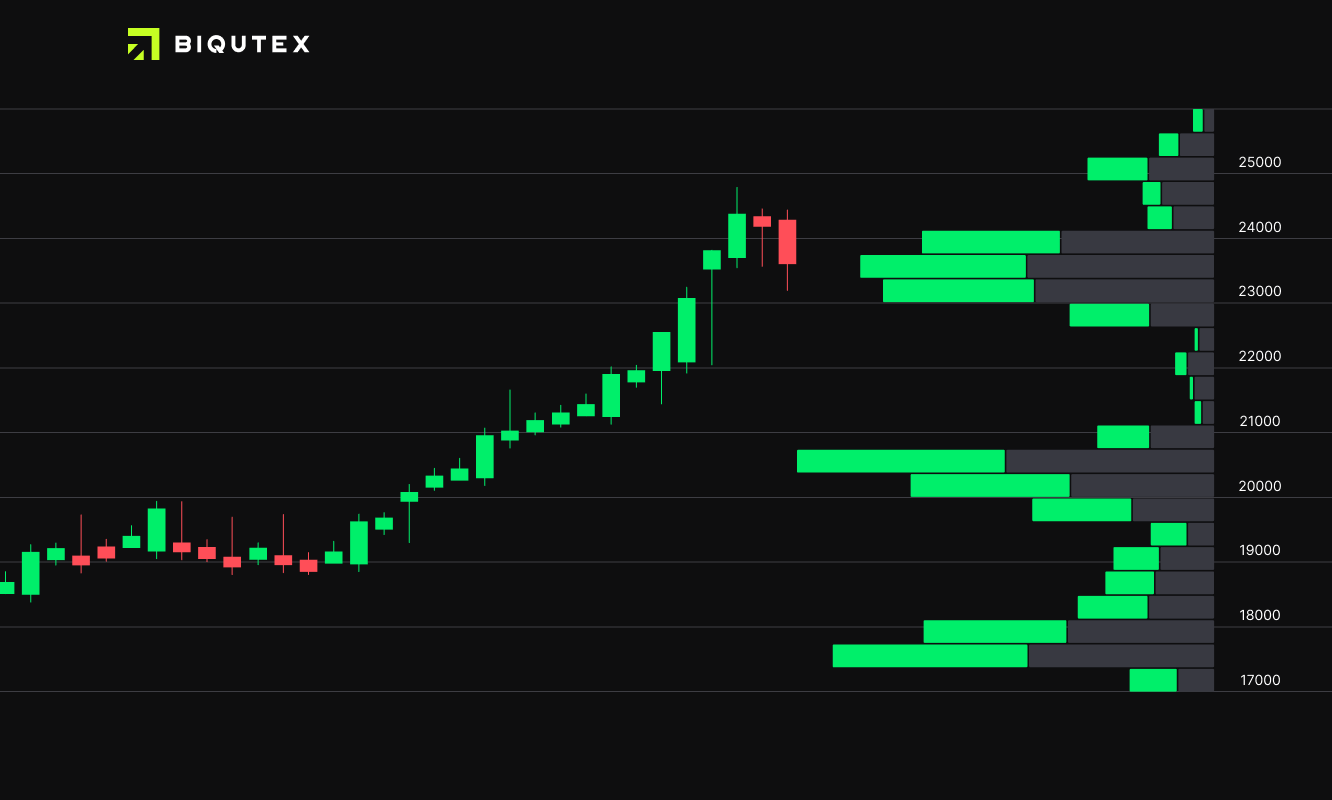
One of the key benefits of using trading trendline crypto is that they can provide a clear visual representation of the direction of the trend. This makes it easy for traders to identify when a trend is starting or ending, and to make predictions about the future direction of the market. Additionally, trend lines can be used to identify key support and resistance levels, which can help traders determine when to enter or exit a trade. Sometimes there is a breakout trendline, what to do in this case - we write below.
What types of trendlines are there?
There are several different types of trend lines available:
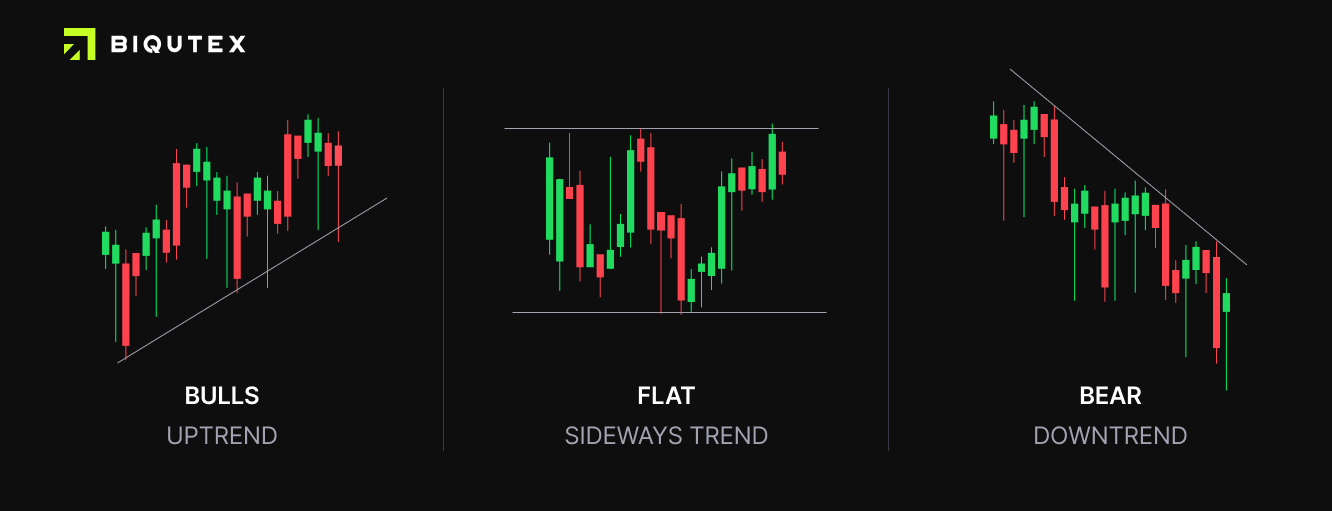
- Uptrend line
A line on a chart that connects a series of rising lows and indicates that the market is in an upward trend. - Down trend line
Unlike uptrend a line on a chart that connects a series of falling highs and indicates that the market is in a downward trend - Sideways trend line
A line on a chart that connects a series of sideways movement, indicating that the market is not experiencing a significant trend in either direction. This is also known as a consolidation or range-bound market.
How to draw crypto trend lines?
To draw a trend line on a tradingview chart, simply select the trend line tool from the charting menu. Then, click on the chart to place the first point of the line. Continue to click on the chart to place additional points, until the trend line is complete. It is important to note that the trend line should be drawn through the price points that best represent the trend.
A trendline breakout occurs when the price of an asset moves above or below a previously established trend line. This can be a sign of a change in the direction of the trend, and can indicate a potential buying or selling opportunity.
Breakout trendline: what to do?
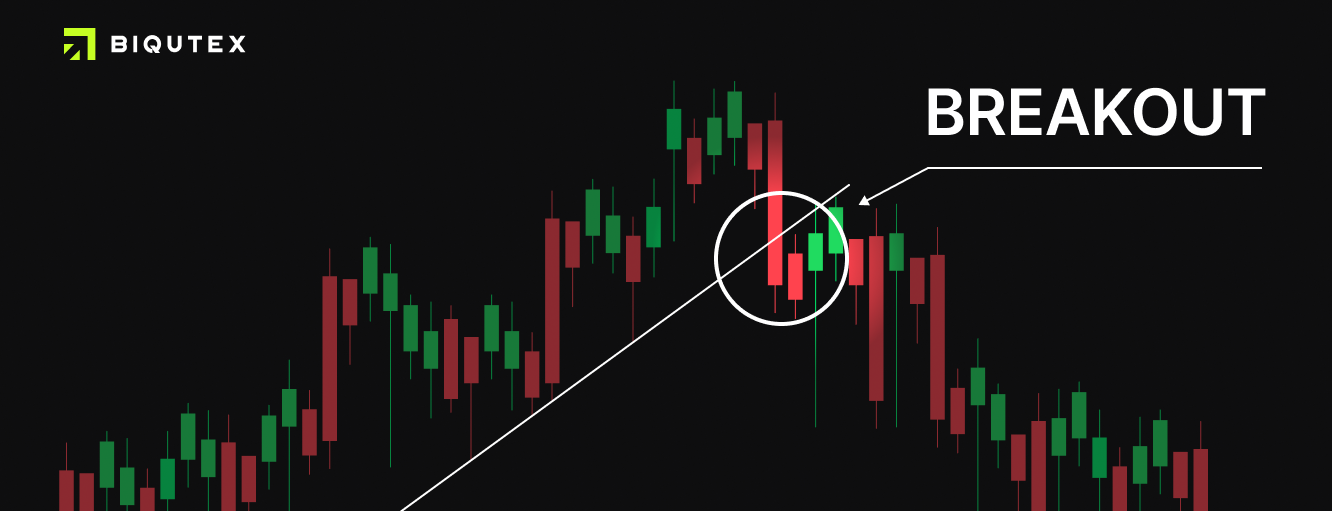
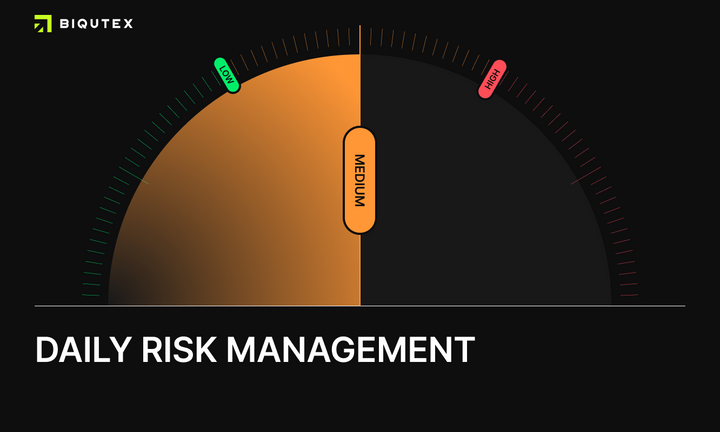
If there is a trendline breakout, traders should take a close look at the chart and consider the overall market conditions. If the breakout is accompanied by strong volume and momentum, it may be a good idea to enter a trade in the direction of the breakout.
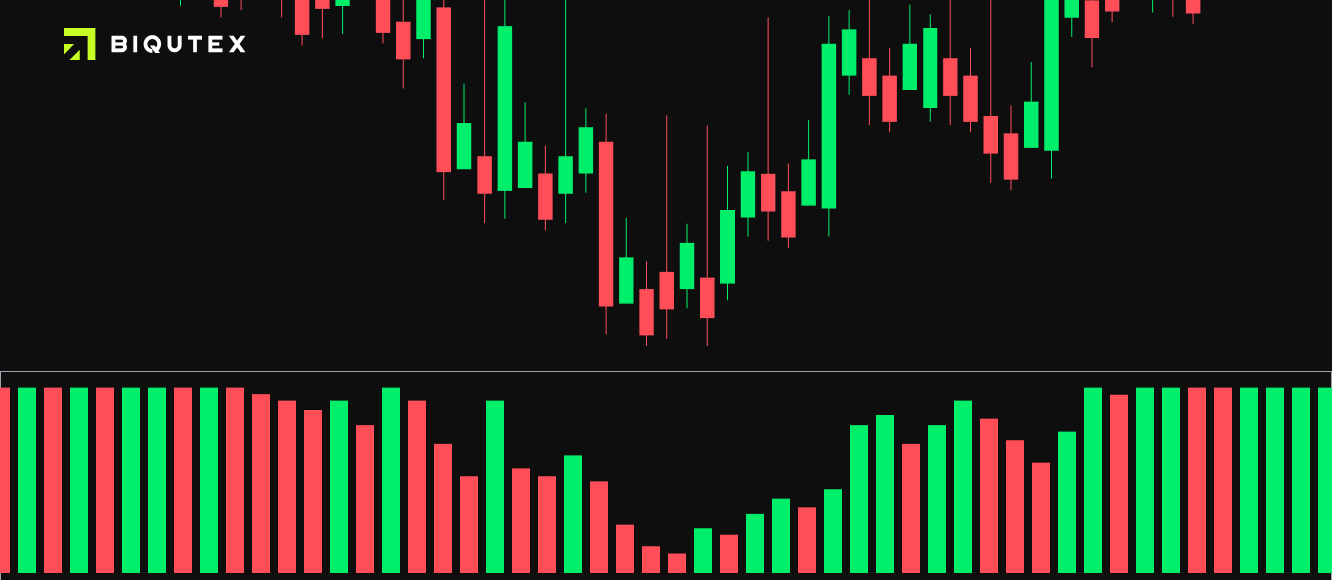
However, if the breakout is accompanied by weak volume and momentum, it may be best to wait for further confirmation before entering a trade.
In conclusion, crypto trend lines are a powerful tool that traders can use to identify trends and make predictions about the direction of the market. These lines can be drawn in different ways, depending on the type of trend line being used, and can provide a clear visual representation of the direction of the trend. Additionally, trading trendline can be used to identify key support and resistance levels, which can help traders determine when to enter or exit a trade. If there is a trendline breakout, traders should take a close look at the chart and consider the overall market conditions before.

Biqutex Exchange
Biqutex is an innovative crypto derivatives exchange. Trade an extended list of instruments (Perpetuals Swaps, Futures, Options, Calendar Spreads etc.) with up to 125x leverage and deep liquidity!