Top 5 classic indicators that you should know
By using zero line as a reference MACD can measure momentum or trend strength If the MACD line crosses ABOVE the zero line, this signals an UPTREND If the MACD line crosses BELOW the zero line, this signals a DOWNTREND MACD strategies can be effectively combined with other indicators.
Trading seems like a fairly simple activity, you buy the assets low and try to sell them high when the right time is around the corner. Some people hold on to their assets and stake them for passive income but how do they actually know the “right” timing for their actions? Is this really possible to be accurate and risk-free? The answer can be very long, let’s dive into it by discussing trading chart indicators and strategies that can assist you big time!
Indicators and Strategies: What does it mean and how are they used?
Trading indicators are a group of technical “indexes” that traders can use to forecast the potential movements in various markets. Most technical indicators are helpful for predicting price changes and identifying patterns in specific markets. Traders rely on these indicators to navigate through the patterns and decide on the best possible strategy for bigger profits.
These tools are also used to define the proportion between supply and demand, but keep in mind that using one indicator might not help you reach your expectations. The more indicators you use the higher the probability of making profits and accurate analysis.
You might want to make sure is not to choose indicators that are contradictory, this will result in losses and increased risks. This is the reason many traders use more than one indicator to create their strategies.
Talking of which, a trading strategy is the set-out specifications on what trades to execute, when to enter or exit a trade, how much capital to invest, and all the key factors that one plans out before a trade. For instance, when you travel you make a list of specifications you need to consider such as the price of the hotel, food, buses, and everything. Nearly like that people plan out their trading with many factors and the key points to minimize risks and maximize success.
There are many types of trading strategies people use but let’s dive into indicators for now as they play a huge part in conducting the strategies.
Here are the top 5 classic indicators you can rely on when trading!
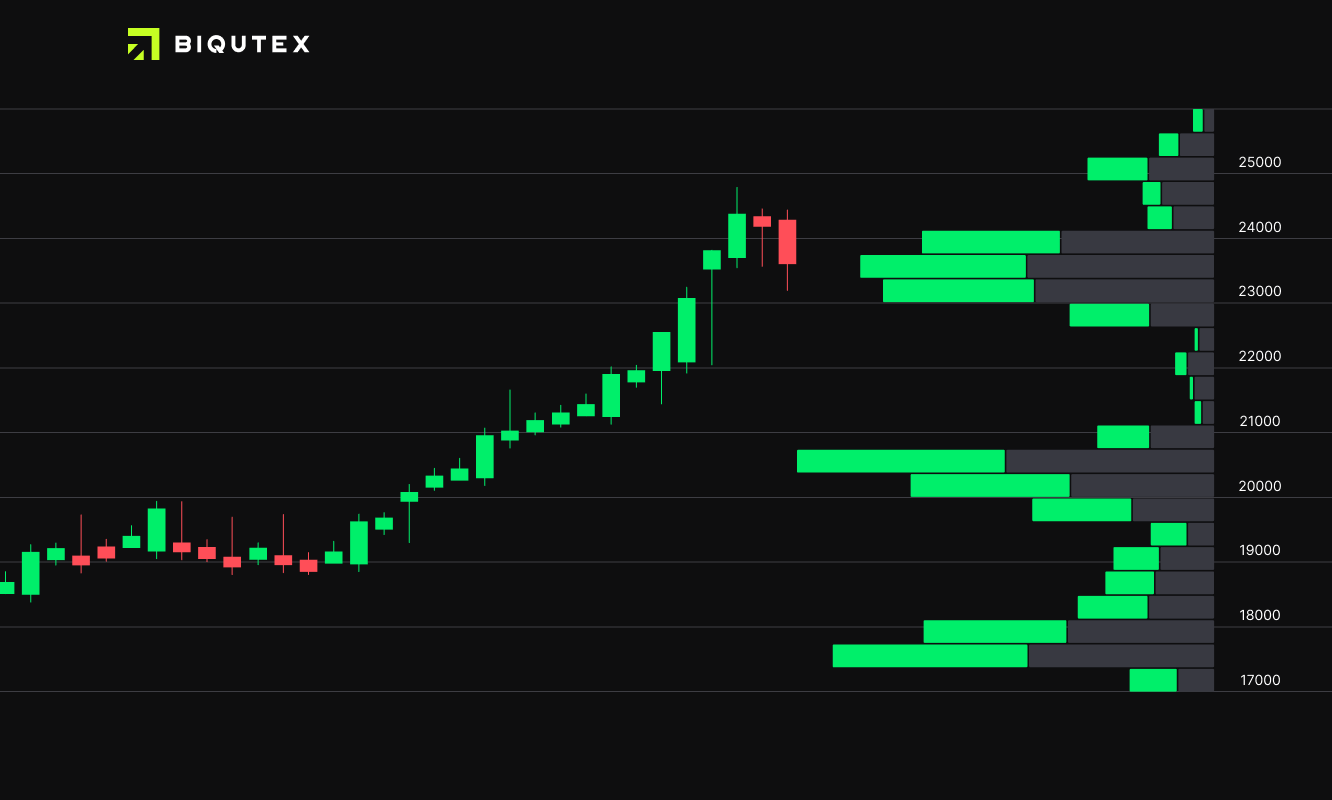
Moving Average Crypto
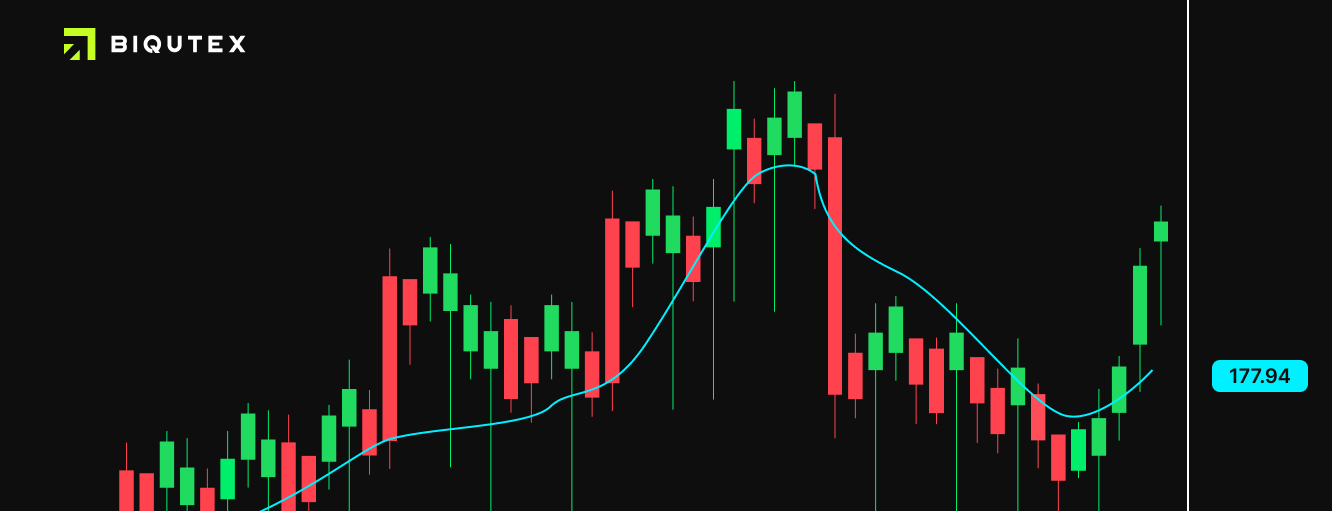
The following indicator is broadly used by many day traders and analysts due to its effectiveness in identifying specific momentum trends. There are 3 types of moving averages (Simple, Exponential, Weighted) As “Simple” is the mostly used one let’s stay on this type. This type is also called SMA (Simple Moving Average).
This indicator is easy to calculate as it represents the average price of an asset, let’s say Bitcoin in a given period of time. SMA 50 for instance is the average price of the previous 50 days. Why is SMA used? Well, to limit an asset’s volatility to a certain time frame. As well as help as identify trends.
If you are a long-time trader, you might focus on higher SMAs, and for short-term trading perhaps focus on recent volatility and lower SMAs.
Relative Strength Index (RSI)
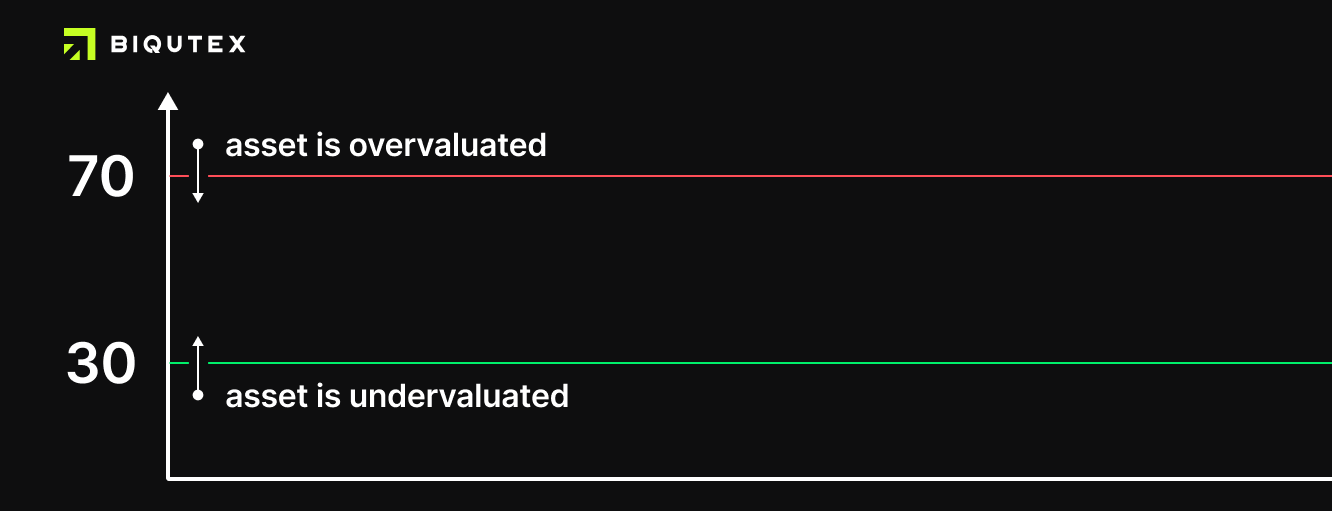
Even if you are a beginner trader you might have heard or know about RSI. This indicator has been in the industry for more than 40 years now. It ranges between 0 and 100. Generally, if the RSI goes above 70 it is a hint that the specific asset is a bit overvalued and a pullback might be approaching. Not good!
At the same time if drops below 30 it can mean that the asset is undervalued. Yes, that’s right, this might be the time for you to buy! Traders usually combine RSI with other indicators and go with the strength Index to measure market sentiment. However, it's important to note that the Relative Strength Index is a lagging indicator, meaning that it is based on past performance and that it can remain overbought or oversold for extended periods of time.
RSI is mainly used as a momentum swing that measures the speed and change of price movements, but it might not represent a general rule of the market behavior long term.
Moving Average Convergence / Divergence (MACD)
Now our stop will be the moving average convergence/ divergence or MACD in short! MACD uses two exponential moving averages but unlike SMA which takes all the prices included in a timeframe into account MACD focuses on the most recent ones. Exponential moving average places a greater weight on recent prices in an attempt to make it more responsive to new information. This feature helps traders to find the bullish and bearish trends a bit more accurately! The name moving average convergence divergence can be confusing right?
So what do convergence and divergence mean and how are they used? ‘Convergence’ means that two moving averages are coming together, while ‘divergence’ means that they’re moving away from each other. If moving averages are converging, it means momentum is decreasing, whereas if the moving averages are diverging, momentum is increasing. Using moving average convergence divergence or let’s say using MACD indicator ease your life for good!
MACD trading is mainly used to identify aspects of a market’s overall trend. Most notably these aspects are momentum, as well as trend direction and duration. MACD trading is loved due to its simplicity and flexibility. Many traders get good results by using MACD strategies.
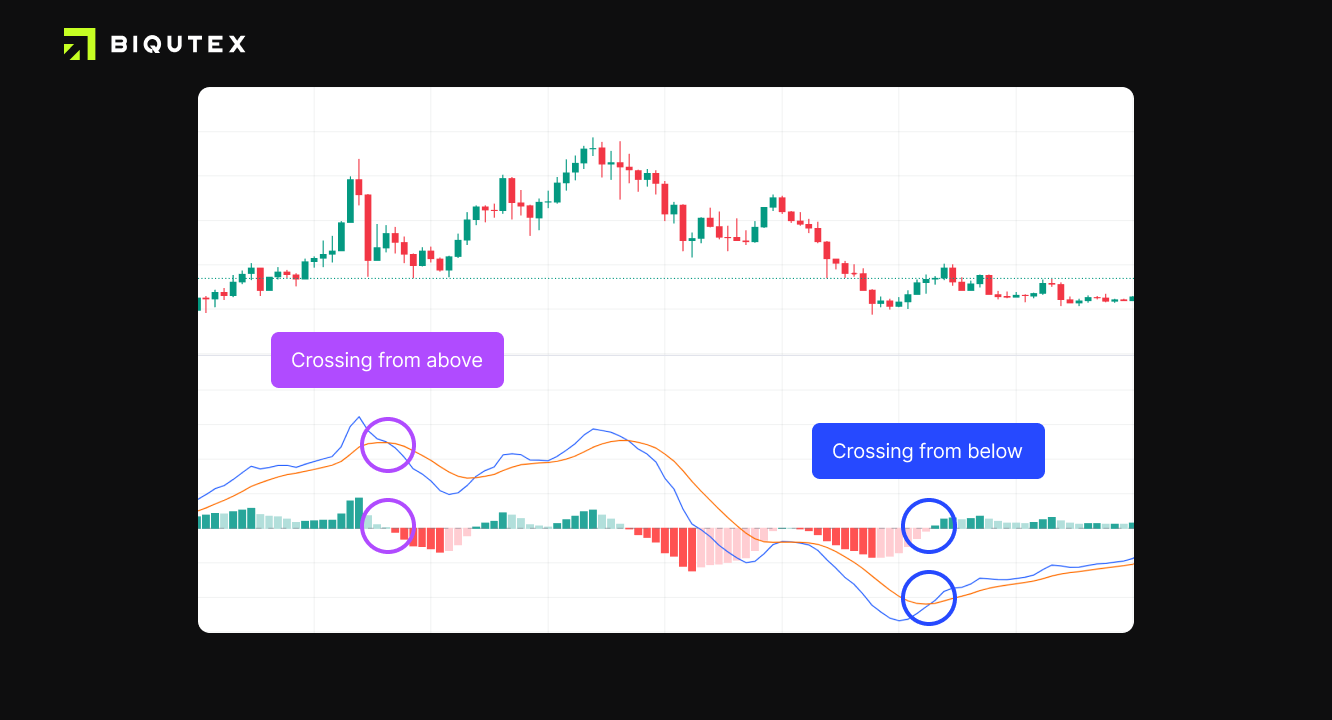
By using zero line as a reference MACD can measure momentum or trend strength If the MACD line crosses ABOVE the zero line, this signals an UPTREND
If the MACD line crosses BELOW the zero line, this signals a DOWNTREND
MACD strategies can be effectively combined with other indicators. Using MACD indicator can get you ready to face different situations.
Bollinger Bands
Developed by John Bollinger this indicator is mainly used for as a price “envelope” What? Yes, price envelopes define upper and lower price range levels which this indicator is aimed for! Bollinger bands meaning is easier than you think. The name suggests this indicator is conducted with 2 main “bands”: upper and lower.
They are used in pairs, and in conjunction with a moving average. How do they actually work in theory? Here are some hints:
- When the bands separate by an unusually large amount, volatility increases and any existing trend may be ending.
- When the bands tighten during a period of low volatility, it raises the likelihood of a sharp price move in either direction. Bollinger bands chart is rather easy to understand.
- Prices have a tendency to bounce within the bands' envelope, touching one band then moving to the other band. You can use these swings to help identify potential profit targets.
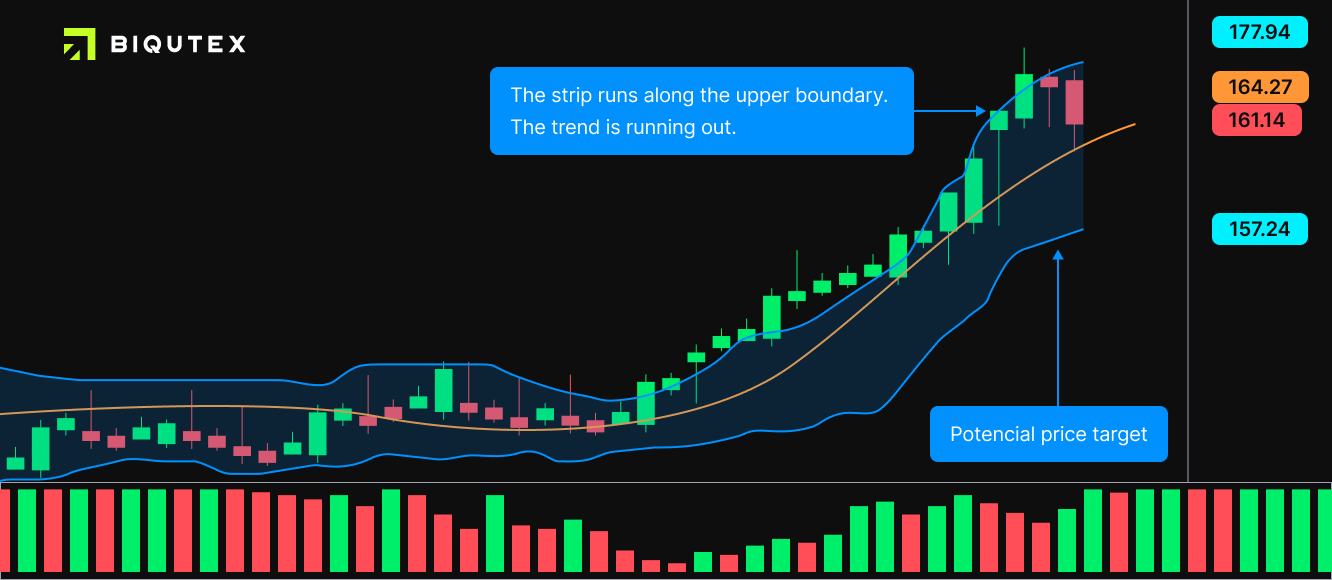
Bollinger bands chart is straightforward to get the hang of. Traders find it convenient and flexible! Bollinger trading can also provide a measure of volatility for a particular security.
Parabolic SAR
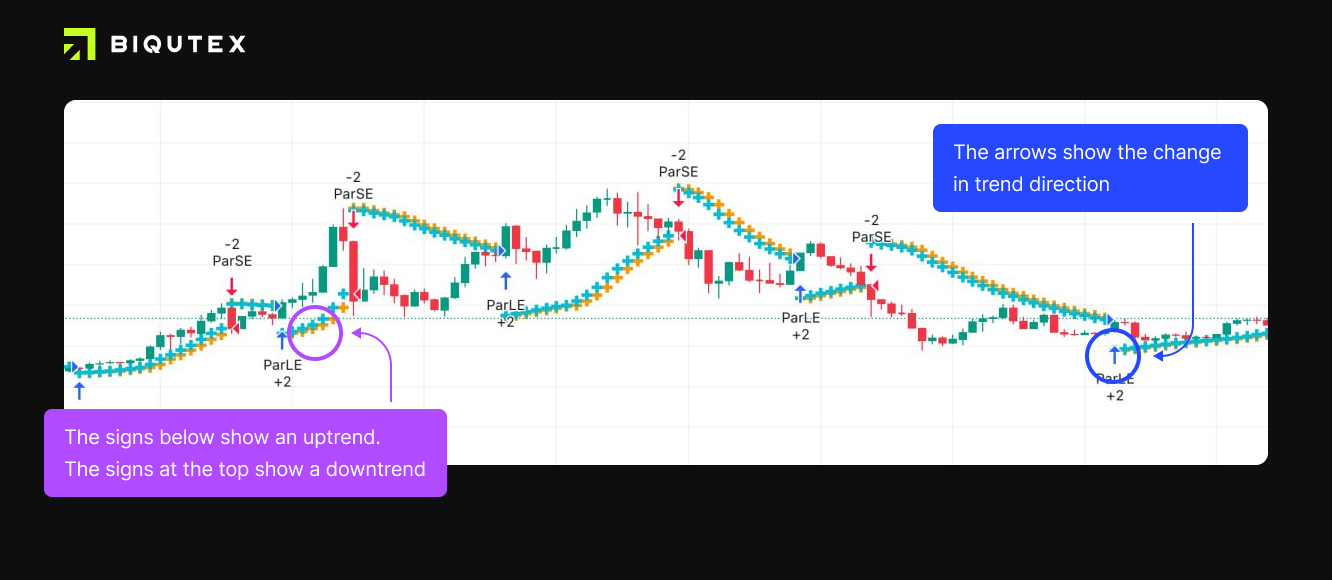
SAR indicator was introduced to the world in 1978 by Welles Wilder and has been a big help for investors since then. Parabolic SAR is a versatile indicator with unique properties. It is a trend-following indicator that focuses on the fact of where a specific trend ends. Why do we need to know this? The name SAR means Stop and Reverse and as it suggests the indicator stops and reverses when the trend itself reverses. The indicator utilizes a system of dots imposed onto a price chart.
When the dots' position changes from one side of the asset's price to the other, the parabolic indicator generates buy or sell signals. For instance, when the dots shift from above the price to below the price, a purchase signal is generated, and when they shift from below the price to above the price, a sell signal is generated, this is how SAR indicator works in general.
Many traders use Parabolic SAR for their exit strategies while others combine it with other indicators and create day trading strategies.
In the end, these indicators can help you create your success in trading but they won’t be enough as you also need a good strategy based on comparing different results and signals. Well, let’s not forget about good trading discipline and constant education, which you can find with us on any topic that matters!

Biqutex Exchange
Biqutex is an innovative crypto derivatives exchange. Trade an extended list of instruments (Perpetuals Swaps, Futures, Options, Calendar Spreads etc.) with up to 125x leverage and deep liquidity!